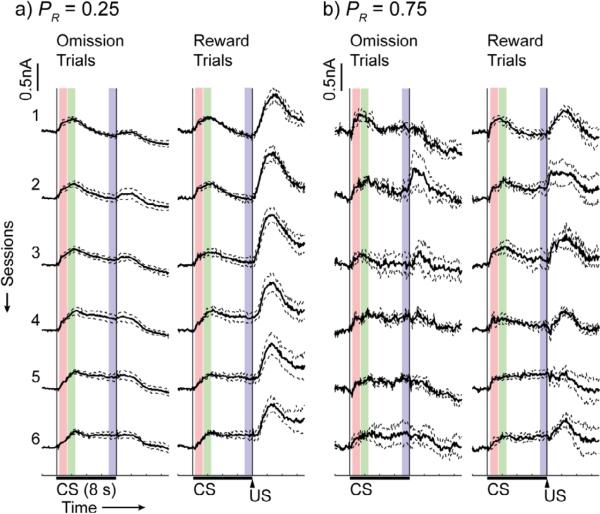
Figure 4.
Mean ± SEM of session-averaged traces for the 0.25 (n = 4), 0.75 (n = 4) groups are shown. Traces from reward and reward omission trials for each session were averaged separately to illustrate differential responding at the time of the US. Colored boxes represent the analysis windows during CS presentation (red: early CS, green: peak CS, blue: late CS).

