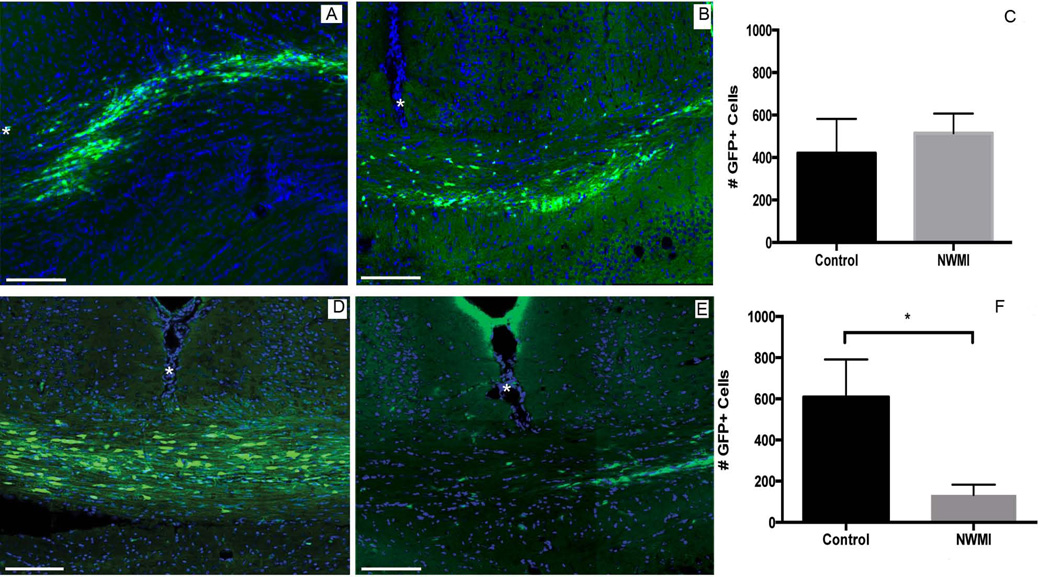
Figure 4. GRP cell survival at 1 month and 2 months post-transplantation.
At 1 month, both groups showed comparable number of surviving cells (A, B, C). However, at 2 months post-transplantation control mice (D) had significantly more surviving GFP+ cells when compared to NWMI mice (E, F, t(28)=2.33, p = 0.02). Plots (C, F) show total number of cells counted in three sections, the one where the injection tract was most prominent, and the immediate anterior and posterior sections. Error Bar indicates 1SE. Scale bar 100 µm.

