
Figure 2. Examples of high and low abdominal visceral fat percentage (VF%). Neither subject experienced a cardiac event during clinical follow-up after CT.
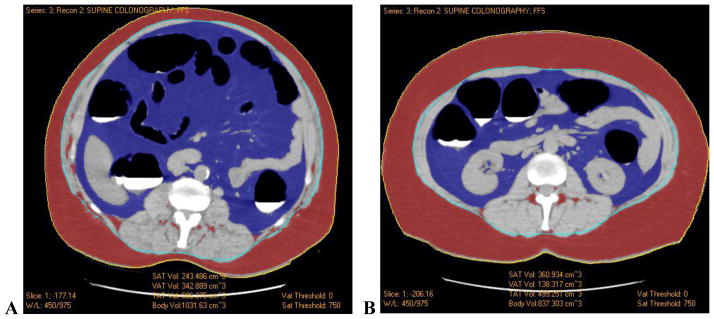
A. CT image at the L2-3 level in a 50-year-old male shows the segmentation of visceral (blue) and subcutaneous (red) adipose tissue by the automated tool. Measurements of subcutaneous (243.5 cm3) and visceral (342.9 cm3) adipose tissue volumes result in a VF% of 58.5%.
B. CT image at the L2-3 level in a 66-year-old male shows similar fat segmentation. Subcutaneous (360.9 cm3) and visceral (138.3 cm3) adipose tissue volumes result in a VF% of 27.7%.