Fig. 1.
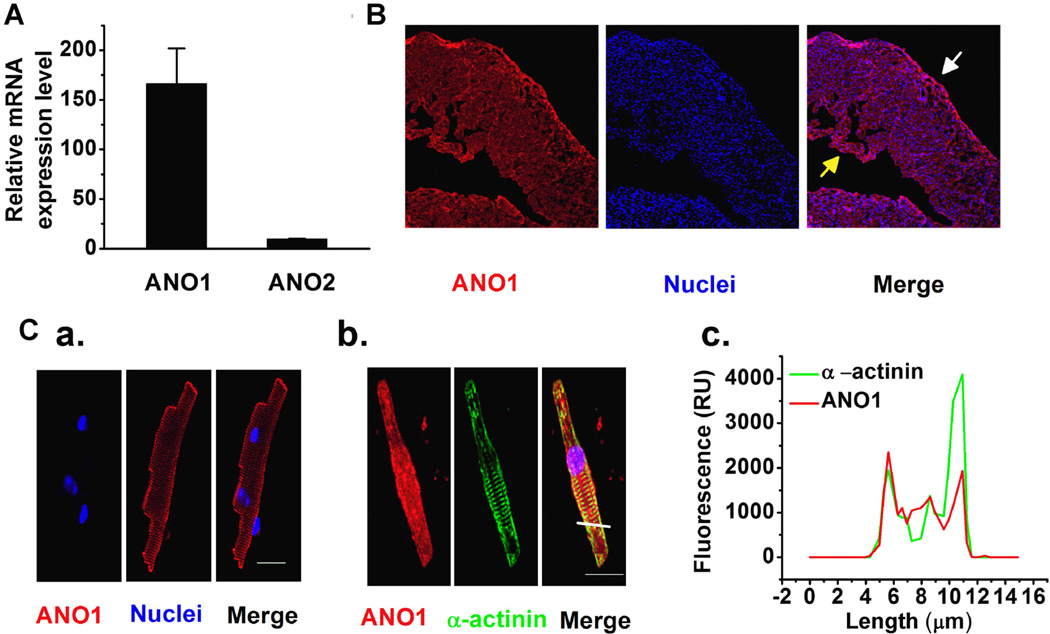
(A) qRT-PCR revealed that ANO1, but not ANO2 expressed in LV tissues (n = 3); (B) Representative immunohistochemistry images demonstrate that ANO1 distributes from epi- (the white arrow head), mid-myocardial and endocardial (the yellow arrow head) layers of the mouse LV. (C) Representative immunofluorescence staining images suggest that ANO1 is localized on the plasma membrane of the ventricular myocytes. Ventricular myocytes labeled with antibody against ANO1 (C,a; red), or co-labeled with antibodies raised against ANO1 (red) and against α-actinin (green) (C,b). Scale bars by white solid lines represent 20 µm. (C,c) The constructed histograms of fluorescence intensity across the cell (where indicated by the yellow solid line in C,b) for ANO1 (the red solid line) and α-actinin (the green solid line) suggest that ANO1 is mainly localized at the plasma membrane of mVMs (C,c).

