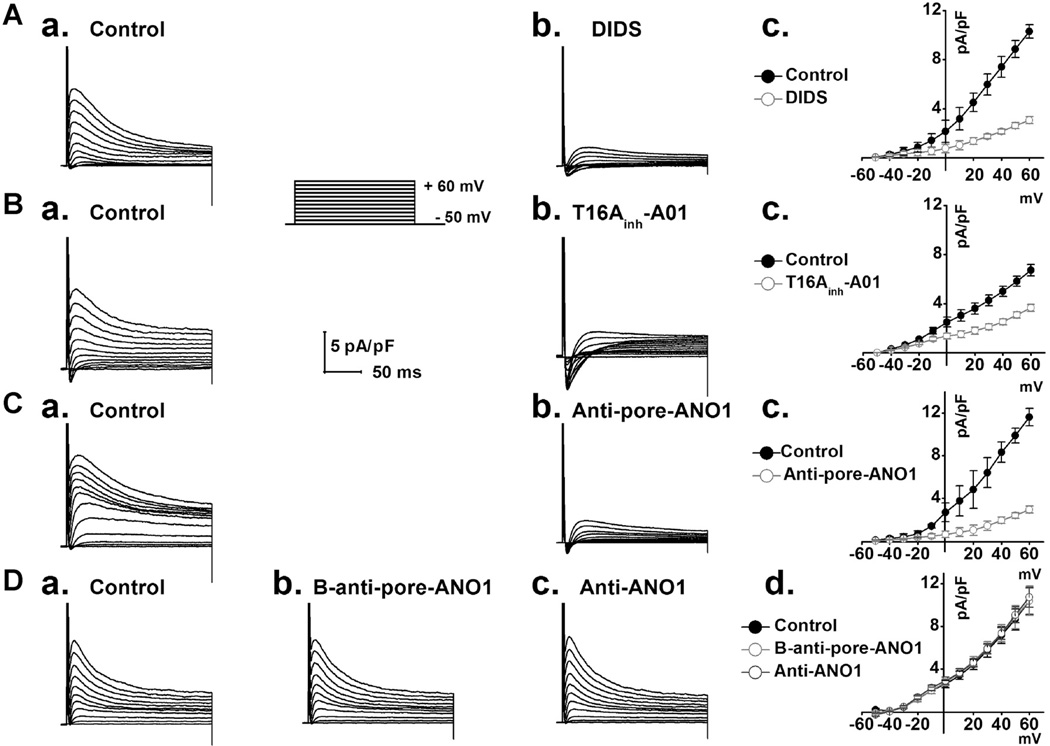
Fig. 2.
A. Representative whole-cell currents were recorded from control (A,a) and in the presence of 150 µmol L−1 DIDS (A,b); average I–V relationships (A,c) were constructed as a function of voltages from records as shown in A,a and A,b (n = 6). B. Representative whole-cell currents were recorded under control condition (B,a) and in the presence of 30 µmol L−1 specific ANO1 blocker T16Ainh-A01 (B,b); I–V relationships (B,c) were constructed against voltages from records as shown in B,a and B,b. (n = 5). C. Representative whole-cell currents were recorded under control condition (C,a) and in the presence of the specific pore-targeting anti-ANO1 antibody in the same ventricular myocyte (C,b); I–V relationships (C,c) were constructed as a function of voltages from records as shown in C,a and C,b (n = 5). D. Representative whole-cell currents were respectively recorded under control condition (D,a), in the presence of the boiled specific pore-targeting anti-ANO1 antibody (D,b) and in the presence of a non-pore-targeting anti-ANO1 antibody (D,c) ; I–V relationships (D,d) were constructed as a function of voltages from records as shown in D,a–c (n = 5). Anti-pore-ANO1, B-anti-pore-ANO1 and Anti-ANO1 respectively represent specific pore-targeting anti-ANO1 antibody, boiled specific pore-targeting anti-ANO1 antibody and non-pore-targeting anti-ANO1 antibody.

