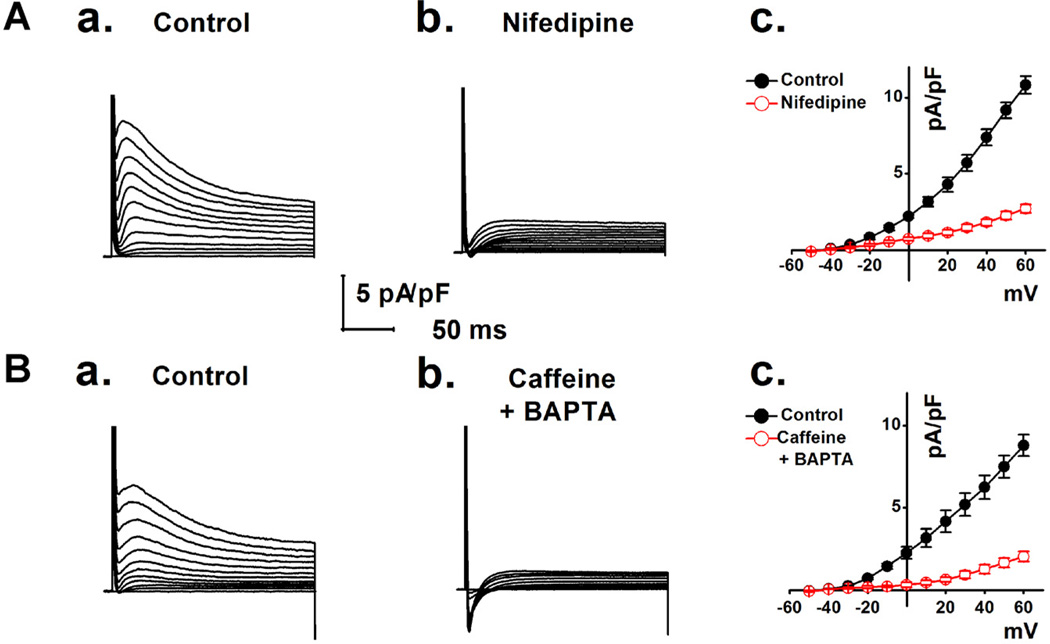
Fig. 4.
A. The representative macroscopic currents were recorded in the absence (A,a) or in the presence of 5 µmol L−1 nifedipine (A,b). I–V relationships from the records as shown in A,a and A,b are shown in panel A,c (n = 7). B. The representative whole-cell currents were recorded in the absence of (B,a) or in the presence of 10 µmol L−1 extracellular caffeine plus 10 mmol L−1 pipette BAPTA (B,b). Panel B,c shows the average I–V curves from the recordings (n = 6) as shown in B,a and B,b.

