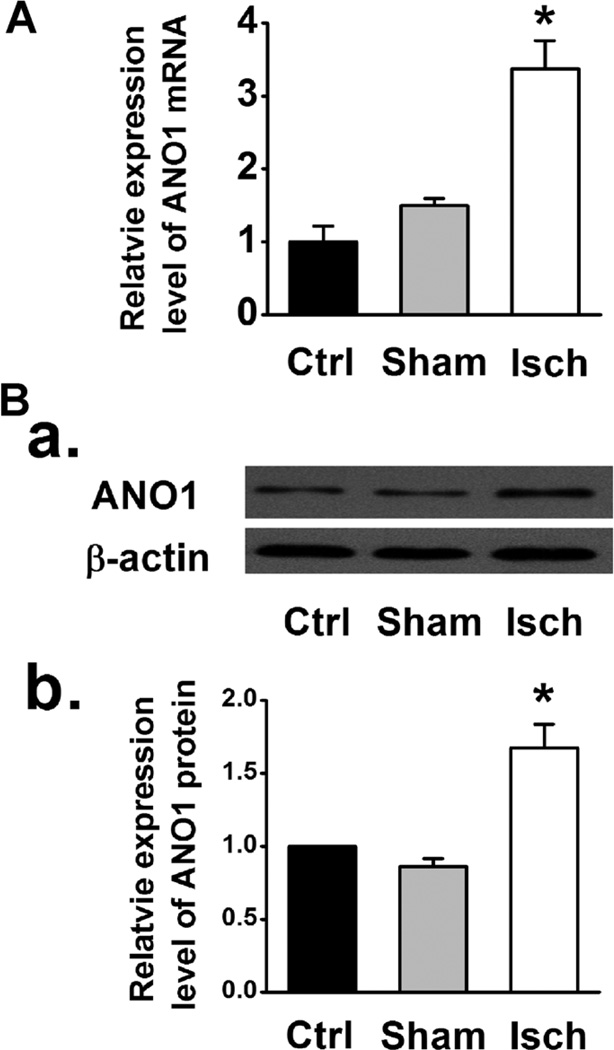
Fig. 7.
(A) Relative mRNA abundance of ANO1 examined by qRT-PCR in LV tissues from control (Ctrl), sham and myocardial ischemia (Isch) groups (n = 3). (B) Representative western blot (B,a) and averaged ANO1 protein densities in the isolated mVMs from control, sham, and myocardial ischemia group (B,b) (n = 5). * Indicates P < 0.05 vs. control or sham.

