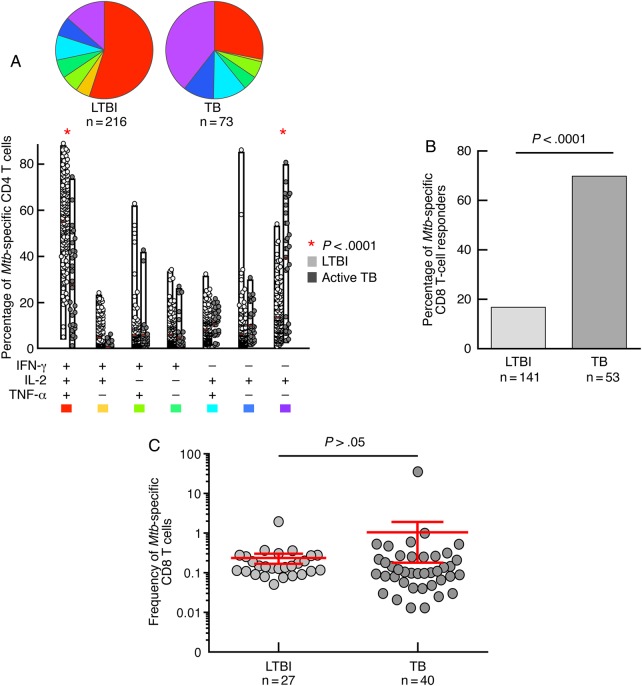
Figure 1.
Mycobacterium tuberculosis (Mtb)-specific CD4 and CD8 T-cell responses. A, Analysis of the functional profile of Mtb-specific CD4 T cells on the basis of interferon gamma (IFN-γ), interleukin 2 (IL-2), and/or tumor necrosis factor alpha (TNF-α) production. All 194 individuals had Mtb-specific CD4 T-cell responses, and 216 and 73 Mtb-specific CD4 T-cell responses against ESAT-6 or CFP-10 were analyzed in the 141 patients with latent tuberculosis (LTBI) and 53 patients with tuberculosis (TB), respectively. The combinations of the different functions are shown on the x-axis, and the percentages of the distinct cytokine-producing cell subsets within Mtb-specific CD4 T cells are shown on the y axis. The pie charts summarize the data. Comparisons of marker distribution were performed using Student t test and a partial permutation test as described elsewhere [8]. B, Proportion of LTBI subjects and TB patients with detectable Mtb-specific CD8 T-cell responses. Mtb-specific CD8 T-cell responses were defined by the presence of IFN-γ–producing CD8+CD4–CD3+ T cells following stimulation with ESAT-6 and/or CFP-10 peptide pools. Statistical significance was calculated using 2-tailed Fisher exact test. C, Magnitude (mean with 95% confidence interval) of Mtb-specific CD8 T-cell responses (against ESAT-6 and/or CFP-10) in the 21 LTBI and 37 TB patients with detectable Mtb-specific CD8 T-cell responses. An unpaired 2-tailed Student t test was performed.

