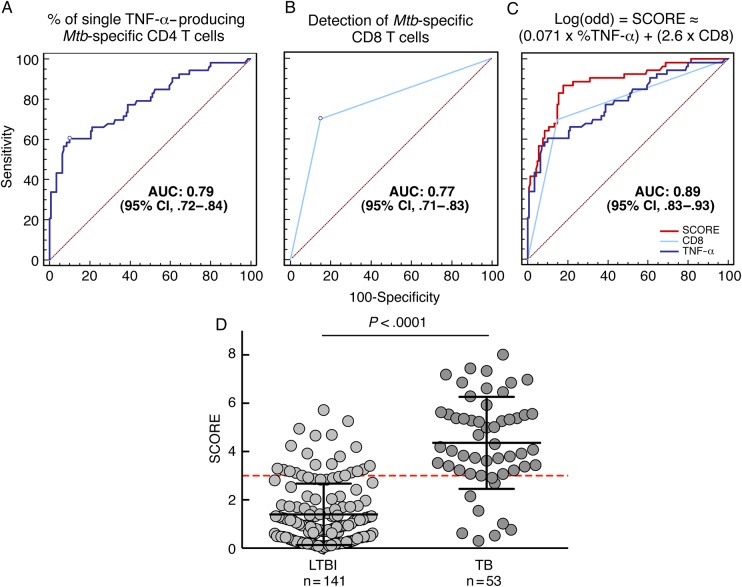
Figure 2.
Individual and combined performances of the distinct components of the Mycobacterium tuberculosis (Mtb)–specific T-cell response to diagnose active tuberculosis (TB). A, Logistic regression analysis showing the association between the proportion of single tumor necrosis factor alpha (TNF-α)–producing CD4 T cells with the ability to discriminate between active TB and latent Mtb infection (LTBI) (area under the curve [AUC] = 0.79 [95% confidence interval {CI}, .72–.84]). B, Logistic regression analysis showing the association between the presence of a detectable Mtb-specific CD8 T-cell response with the ability to discriminate between active TB and LTBI (AUC = 0.77 [95% CI, .71–.83]). C, Logistic regression analysis showing the association between the SCORE (integrated combination of the proportion of single TNF-α–producing CD4 T cells and the presence of a detectable Mtb-specific CD8 T-cell response) with the ability to discriminate between active TB and LTBI (AUC = 0.89 [95% CI, .83–.93]). D, Analysis of the distribution of SCORE results on the 141 LTBI subjects and the 53 active TB patients from this study.

