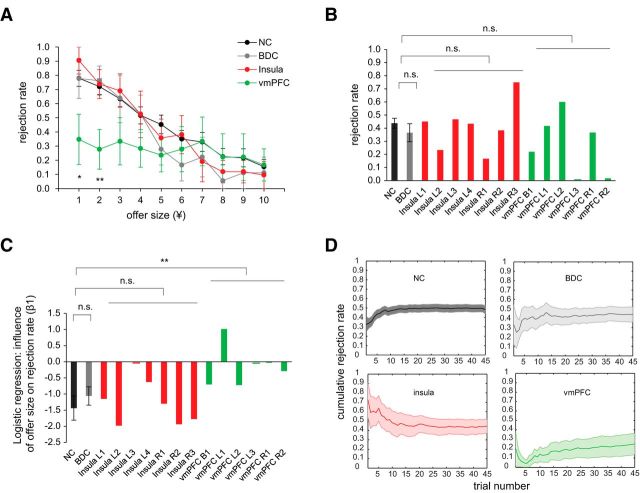
Figure 2.
A, Rejection rate at each offer size. Patients with vmPFC lesions rejected less in the most unfair conditions (¥ 1 and ¥ 2). B, There were no significant group differences in overall rejection rate. C, The influence of offer size on rejection calculated by a logistic regression model was significantly reduced in patients with vmPFC lesions. D, Trajectories of cumulative rejection rate; *p < 0.05; **p < 0.01; n.s., not significant. L, Left; R, right; B, bilateral. Data are represented as mean ± SEM.

