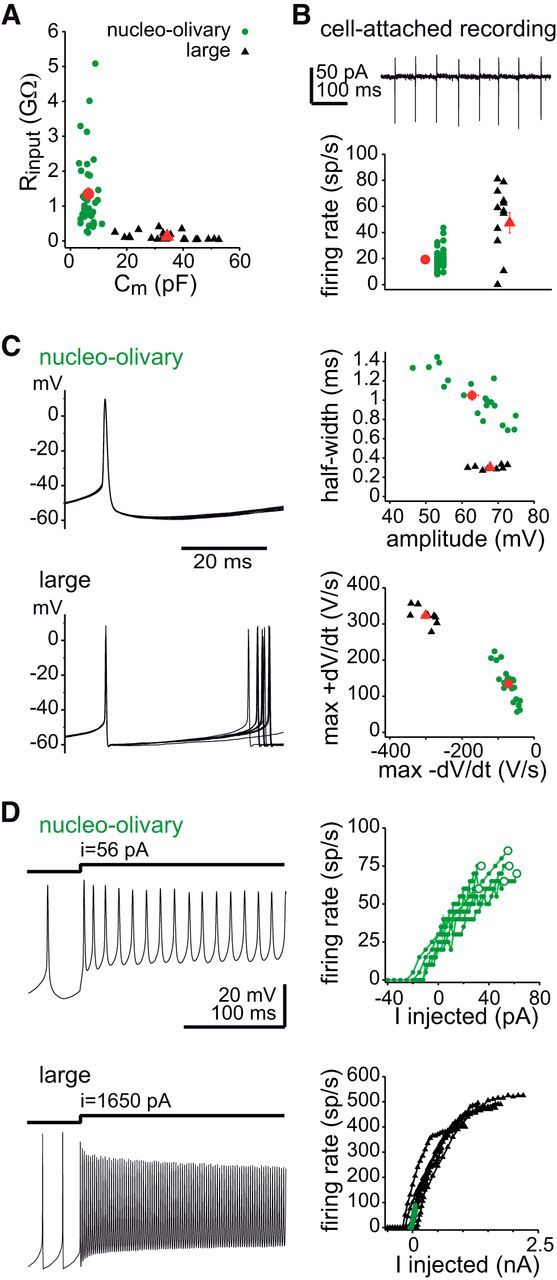
Figure 2.

Comparison of intrinsic properties of nucleo-olivary and large CbN cells. A, Input resistance versus capacitance. Green circles, nucleo-olivary cells; black triangles, large cells; red symbols, means. B, Spontaneous firing in cell-attached recordings. Top, Recording from a nucleo-olivary cell. Bottom, Spontaneous rates for all cells. C, Action potential waveforms. Left, Sample records. Ten superimposed traces for each cell. Right, Spike half-width versus amplitude (top); maximum positive slope (max dV/dt) versus maximum negative slope (max −dV/dt). D, Responses to step depolarizing currents. Left, Traces showing maximal firing rates: 75 Hz (top), 360 Hz (bottom). Right, Input–output curves. Open green circles indicate maximum injection for each response, i.e., larger injections produced depolarization block. Nucleo-olivary data are superimposed for comparison in the bottom.
