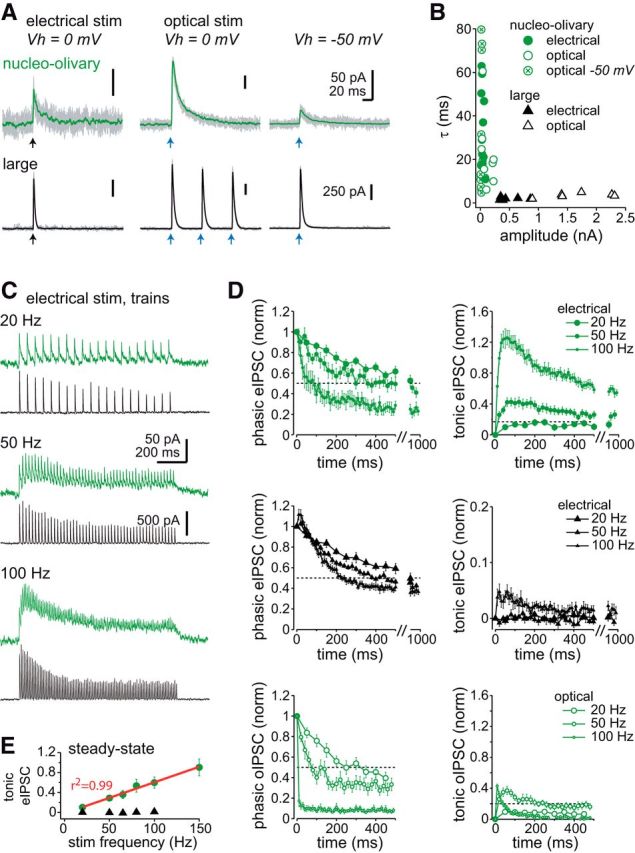
Figure 3.

Comparison of IPSCs in nucleo-olivary and large cells. A, Left, Raw (gray) and mean (green, nucleo-olivary; black, large) evoked IPSCs. Records repeated in SR95531 were subtracted to reduce artifacts and isolate GABAAR-mediated current. Arrows indicate time of electrical or optical stimulation, as labeled. B, Decay time constant (τ) versus IPSC amplitude. Open symbols, oIPSCs; closed symbols, eIPSCs. C, eIPSCs evoked by 1 s trains of increasing frequencies, Vh = 0 mV. D, Phasic (left) and tonic (right) eIPSCs (top two parts) or oIPSCs (bottom), normalized to the peak of IPSC1. Dotted lines are at 0.5 (left) and 0.2 (right) to facilitate comparison. E, Steady-state tonic eIPSCs versus stimulation frequency in nucleo-olivary and large cells (n ≥ 6, all points).
