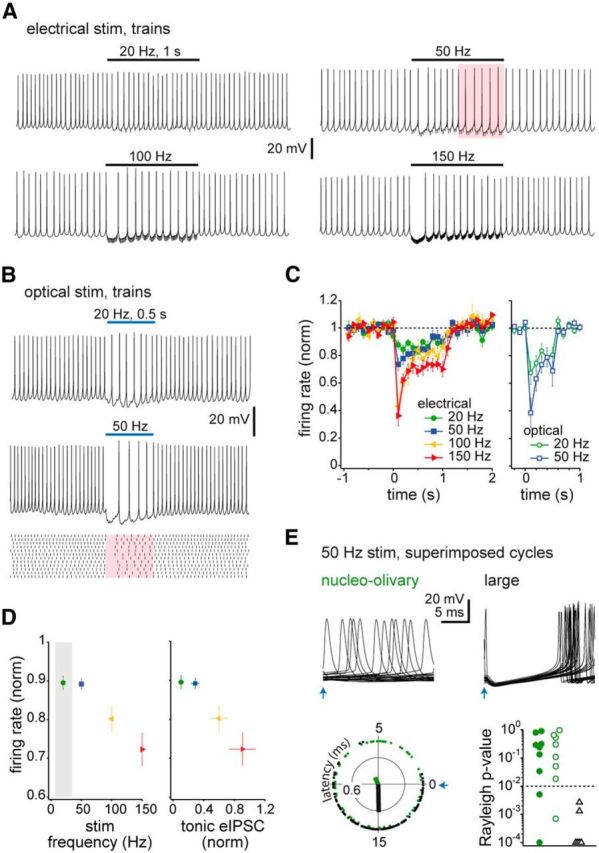
Figure 4.

Synaptic inhibition of spiking in nucleo-olivary cells. A, Responses of a current-clamped nucleo-olivary cell to 1 s eIPSP trains. Black lines, stimulus duration; pink shading, time window analyzed in E. B, Top and pink shading, As in A, for 0.5 s oIPSP trains. Bottom, Raster plot of 12 trials for 50 Hz stimulation. C, Change in firing rate induced by eIPSPs and oIPSPs, measured in 100 ms time bins and normalized to baseline; 0 ms, stimulus onset. D, Firing rate in the last 500 ms of stimulation versus electrical stimulation frequency (left) and tonic eIPSCsteady from Figure 3E (right). Gray shading illustrates range of spontaneous firing rates. E, Top, 25 superimposed responses of a nucleo-olivary and a large cell to 50 Hz oIPSPs, with stimulation times aligned at the blue arrow. Bottom, left, Polar plot of latency to each spike relative to an optical stimulus at 0 ms. Green, nucleo-olivary; black, large cell. Thick lines, net vectors. Right, P values for each cell from Rayleigh test indicating nonuniform (p < 0.01, dotted line) or uniform (p > 0.01) distribution. Open symbols, oIPSPs; filled symbols, eIPSPs. Five cells with p < 0.0001 are plotted at p = 0.0001 for clarity.
