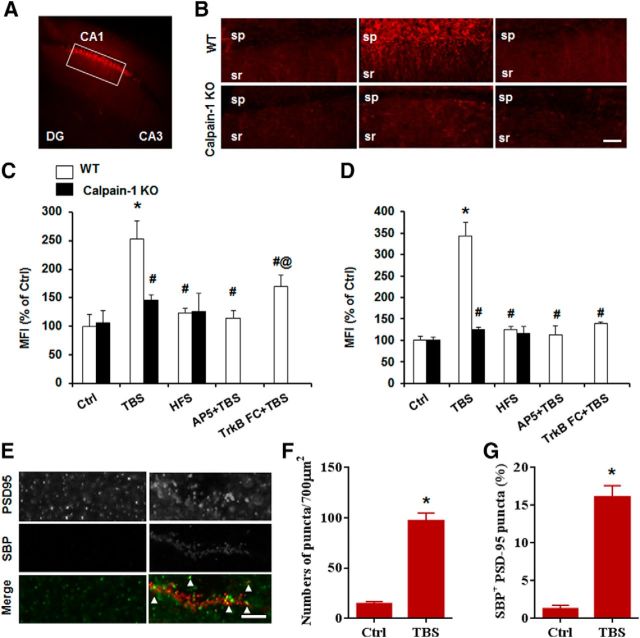
Figure 2.
TBS, but not HFS, triggers calpain-mediated spectrin degradation. A, Representative image with SBP staining after TBS in hippocampal slices from WT mice. B, Baseline, TBS-, and HFS-induced spectrin truncation in slices from WT (top row) and calpain-1 KO mice (bottom row). Scale bar, 50 μm. sp, Stratum pyramidale; sr, stratum radiatum. C, D, Quantification of SBP mean fluorescence intensity around the stimulus electrode in stratum radiatum and stratum pyramidale of CA1. E, Colocalization of SBP and the postsynaptic marker, PSD-95. Scale bar, 5 μm. F, Quantification of SBP punctas after TBS. G, Quantification of SBP-positive PSD-95 punctas, calculated as percentage of PSD-95 punctas (for quantification description, see Material and Methods). In all cases, data are means ± SEM for 6 slices from 3 animals in each group. *p < 0.05, compared with Ctrl in WT (two-way ANOVA followed by Bonferroni test). #p < 0.05, compared with TBS in WT (two-way ANOVA followed by Bonferroni test). @p < 0.05, compared with AP5 + TBS in WT (two-way ANOVA followed by Bonferroni test).

