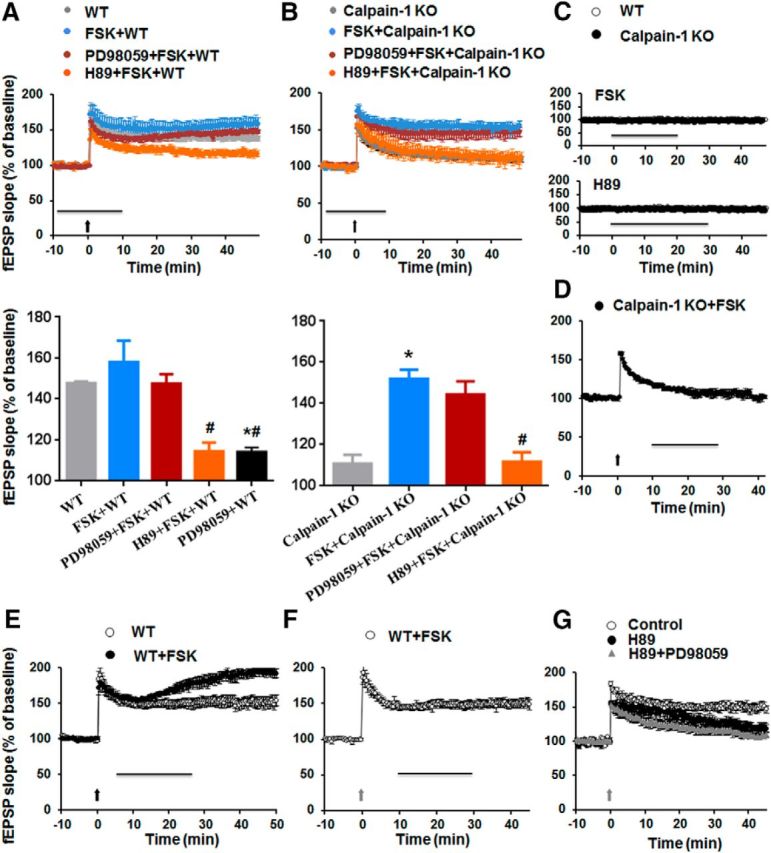
Figure 6.

Effect of FSK on TBS-induced LTP in WT and calpain-1 KO mice. A, Effects of FSK (10 μm), PD98059 (10 μm), and H89 (10 μm) on TBS-induced LTP in hippocampal slices from WT mice. Horizontal line indicates FSK application. PD98059 and H89 were applied at least 30 min before TBS (black arrow). LTP magnitude measured 40 min after TBS. Data are percentage of the fEPSP slope normalized to the average value during the 10 min baseline period and expressed as means ± SEM of 5 experiments. B, Effects of FSK (10 μm), PD98059 (10 μm), and H89 (10 μm) on TBS-induced LTP in hippocampal slices from calpain-1 KO mice. Drugs were applied together during the period indicated by the horizontal line. TBS (black arrow) was delivered at t = 0. LTP magnitude 40 min after TBS. Data are percentage of the fEPSP slope normalized to the average value during the 10 min baseline period and expressed as means ± SEM of 5 experiments. *p < 0.05, compared with the groups without drug application (two-way ANOVA followed by Bonferroni test). #p < 0.05, compared with FSK groups (two-way ANOVA followed by Bonferroni test). C, Effect of 10 μm FSK (20 min) and 10 μm H89 (30 min) on baseline synaptic transmission in slices from both WT and calpain-1 KO mice. D, E, Effects of postapplication of FSK (10 μm, 20 min, black line) on TBS-LTP in calpain-1 KO (D) and WT (E) mice. F, Effect of postapplication of FSK (10 μm, 20 min) on HFS-LTP in WT mice. G, Effect of preapplication of H89 (10 μm) on HFS-induced LTP in the absence or presence of PD98059 (10 μm). PD98059 and H89 were applied 30 min before stimulation. Black arrow indicates TBS. Gray arrow indicates HFS.
