
Figure 3.
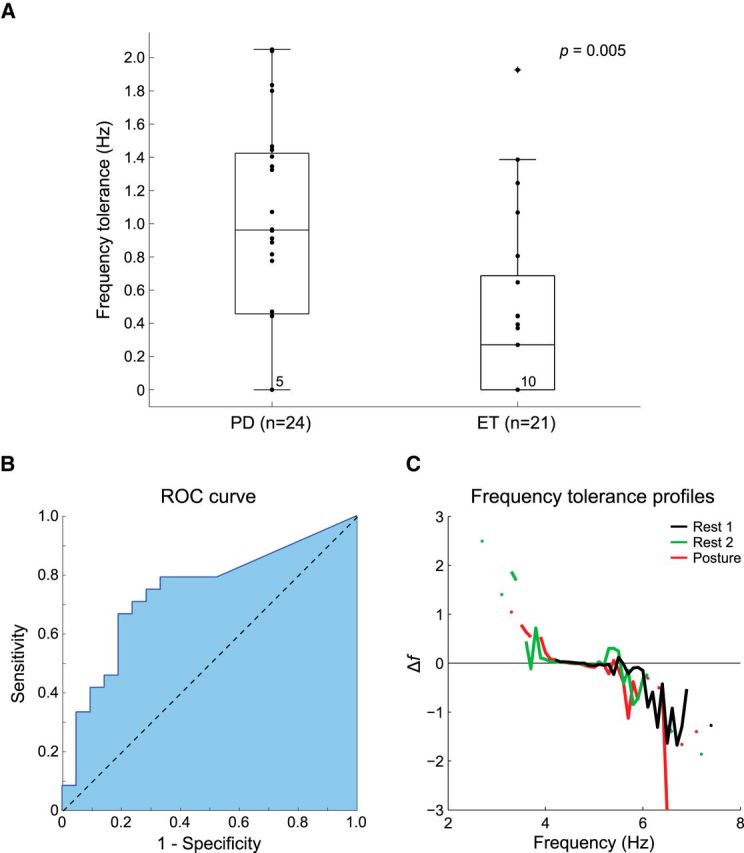
Frequency tolerance distinguishes parkinsonian tremor from ET. A, Frequency tolerance is presented for the combined cohort of PD (n = 24) and ET (n = 21) patients. Box-plots delineate the 25th and 75th percentiles with medians represented by horizontal bars. Whiskers extend 1.5 times the interquartile range beyond the 25th and 75th percentiles. Individual dots indicate patient data. The number of subjects in each group best fit by simple linear regression is stated at the zero crossing. The group split in the combined cohort is highly significant (Wilcoxon rank sum, z = −2.794, p = 0.005). B, ROC curve depicting the sensitivity and specificity of frequency tolerance as a diagnostic differentiator between PD and ET. C, Frequency tolerance profiles for a representative patient with PD contrasting their resting tremor (Rest 1) with resting tremor on a subsequent visit (Rest 2) and postural tremor (Posture).