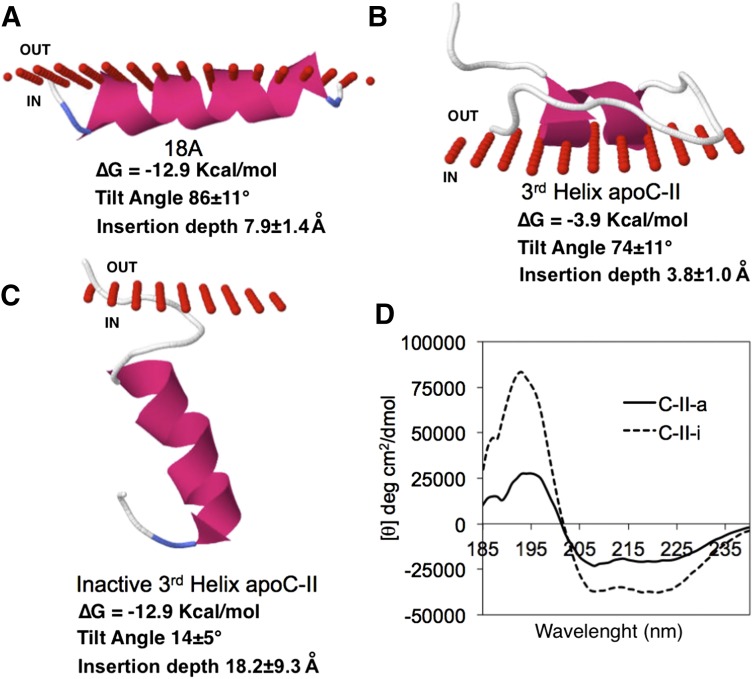
Fig. 2.
Structure models of apoC-II mimetic peptides. Structural models for the binding of 18A (A), third helix apoC-II (B), and Ala-substituted third helix apoC-II (C) are shown. Red circles represent the boundary between phospholipid headgroups (out) and acyl chains below (in). Lipid binding parameters are listed below. (D) Circular dichroism spectrum of indicated peptides in 10% 2,2,2-trifluoroethanol.

