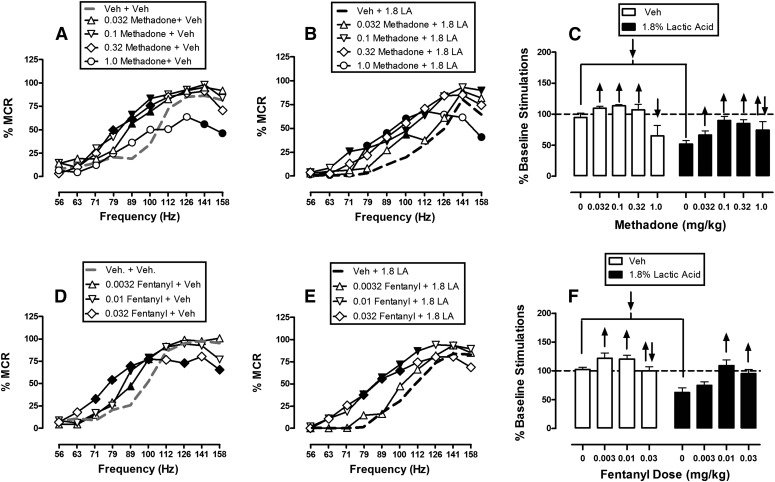
Fig. 3.
Effects of methadone (A–C, n = 6) and fentanyl (D–F, n = 5) on control and 1.8% acid-depressed ICSS. Left and center panels show drug effects on full frequency-rate curves when drugs were administered as a pretreatment to vehicle (left panels in A and D) or 1.8% lactic acid (center panels in B and E). Abscissae: frequency of electrical brain stimulation in hertz (log scale). Ordinates: %MCR. Right panels (C and F) show summary data for drug effects on the total number of stimulations per component when drugs were administered as a pretreatment to vehicle (open bars) or acid (filled bars). Abscissae: dose of drug in milligrams per kilogram. Ordinate: percent baseline number of stimulations per component. Statistical results for two-way ANOVA of full frequency-rate curves are as follows. (A) Significant main effects of frequency [F(9,45) = 41.2, P < 0.001] and dose [F(4,20) = 5.9, P = 0.003], and a significant interaction [F(36,180) = 3.0, P < 0.001]. (B) Significant main effects of frequency [F(9,45) = 41.2, P < 0.001] and dose [F(4,20) = 3.8, P = 0.018], and a significant interaction [F(36,180) = 4.2, P < 0.001]. (D) Significant main effect of frequency [F(9,36) = 72.8, P < 0.001], but not dose [F(3,12) = 1.1, P = 0.384]; the interaction was significant [F(27,108) = 4.3, P < 0.001]. (E) Significant main effects of frequency [F(9,36) = 63.5, P < 0.001] and dose [F(3,12) = 6.1, P = 0.009], and a significant interaction [F(27,108) = 1.7, P = 0.030]. Filled symbols indicate a significant difference from vehicle plus vehicle (A and D) or vehicle plus lactic acid (B and E) (Holm–Sidak post hoc test, P < 0.05). Upward/downward arrows indicate that the drug dose produced a significant increase/decrease in ICSS at one or more frequencies when comparing the full frequency-rate curves. LA, lactic acid; Veh, vehicle.

