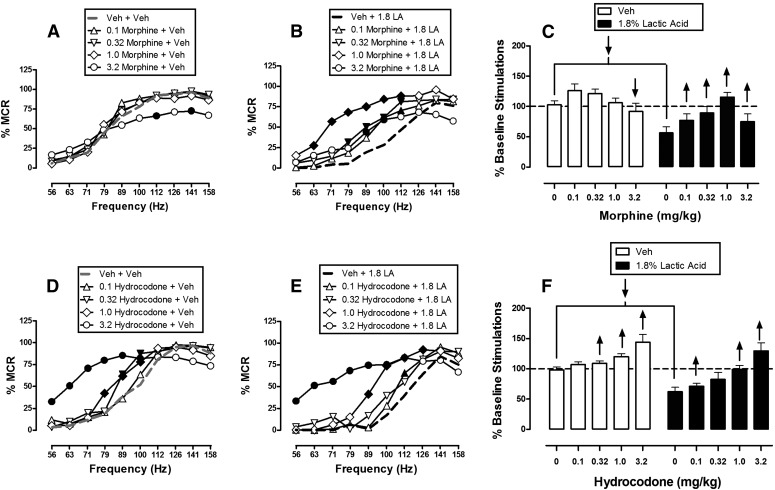
Fig. 4.
Effects of morphine (A–C, n = 6) and hydrocodone (D–F, n = 6) on control and 1.8% acid-depressed ICSS. Details are as in Fig. 3. Statistical results for two-way ANOVA of full frequency-rate curves are as follows. (A) Significant main effect of frequency [F(9,45) = 91.9, P < 0.001], but not dose [F(4,20) = 1.2, P = 0.356]; the interaction was significant [F(36,180) = 2.2, P < 0.001]. (B) Significant main effects of frequency [F(9,45) = 56.8, P < 0.001] and dose [F(4,20) = 8.2, P < 0.001], and a significant interaction [F(36,180) = 2.7, P < 0.001. (D) Significant main effects of frequency [F(9,45) = 71.0, P < 0.001] and dose [F(4,20) = 8.0, P < 0.001], and a significant interaction [F(36,180) = 5.6, P < 0.001]. (E) Significant main effects of frequency [F(9,45) = 70.0, P < 0.001] and dose [F(4,20) = 9.4, P < 0.001], and a significant interaction [F(36,180) = 5.8, P < 0.001]. LA, lactic acid; Veh, vehicle.

