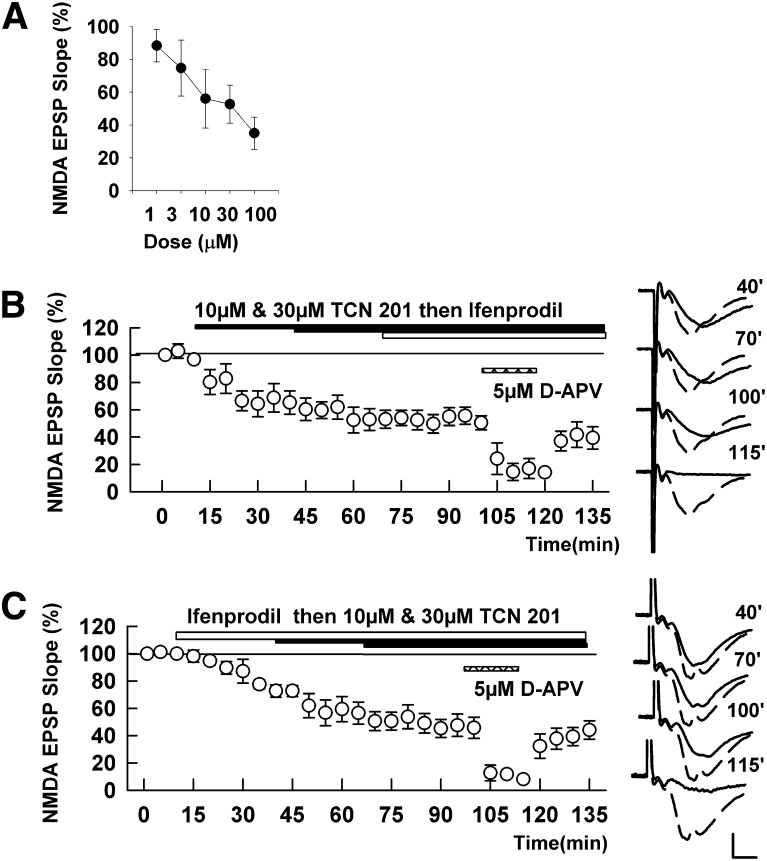
Fig. 2.
Effects of TCN 201 on NMDA EPSPs. (A) In three slices, concentrations of TCN 201 were increased every 15 minutes to create a concentration-response curve. (B) TCN 201 (10 µM, then 30 µM; solid bar) only partially depressed NMDA EPSPs. Addition of 10 µM ifenprodil (open bar) failed to further depress NMDA EPSPs. Addition of 5 µM D-APV (hatched bar) almost completely suppressed NMDA EPSPs in the presence of TCN 201 and ifenprodil. (C) In the presence of 10 µM ifenprodil (open bar) TCN 201 (10 µM, then 30 µM; solid bars) produced only a small further increase in NMDA EPSP suppression. D-APV (5 µM; hatched bar) depressed NMDA-EPSPs almost completely in the presence of ifenprodil and TCN 201. Traces to the right of the graph show NMDA EPSPs at the times denoted with initial control responses shown as dashed lines. Values are expressed as the mean ± S.E.M. N = 5 for each experiment. Calibration: 1 mV; 5 milliseconds.

