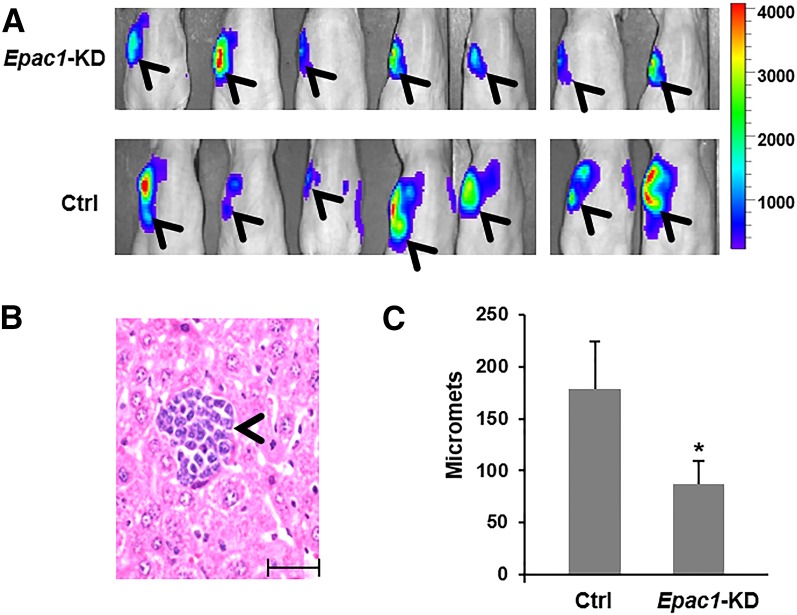
Fig. 2.
Suppression of EPAC1 reduces metastasis of MIA PaCa-2. (A) Cells were injected into the pancreas of athymic nude mice, and invasion/metastasis was monitored in vivo by bioluminescence imaging. The image shown was obtained 3 weeks post< >injection. Arrowheads show signal from the primary tumor and local invasion. (B) Representative image of H&E staining of the liver showing a metastatic focus (micromets) of MIA PaCa-2 cells (arrowhead); scale bar, 10 µm. (C) Quantification of liver micromets (number of micromets/H&E slide). For each mouse, the number of micromets is the average of two slides taken ∼20 µm apart. *Significantly lower than vehicle-treated group (P < 0.02). Bars represent mean ± S.D.

