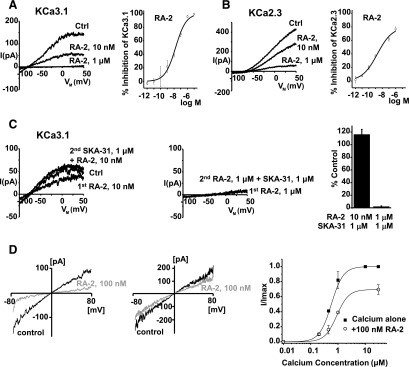
Fig. 2.

Negative-gating modulation of KCa2/3 channels by RA-2. (A) Left panel: inside-out patch-clamp experiments showing concentration-dependent inhibition of cloned hKCa3.1. (B) Left panel: inhibition of cloned hKCa2.3. Right panels (A and B): concentration-response curves. Data points (mean ± S.E.M.; KCa3.1: n = 4–10, experiments for each concentration; KCa2.3: n = 2–12, experiments each) were fitted with the Boltzmann equation (A) or the dose-response equation (B). (C) The positive-gating modulator SKA-31 (1 µM) reversed KCa3.1 channel inhibition at nanomolar (left panel) but not at micromolar concentrations of RA-2 (right panel). Lower panel: quantitative data (mean ± S.E.M.; n = 3, experiments for each concentration). (D) Left and middle panels: representative currents from inside-out patches in the presence of 500 nM (top) and 30 µM (bottom) intracellular Ca2+ before and after application of 100 nM of RA-2. Right panel: Ca2+-concentration response curve for KCa3.1 activation measured from inside-out patches in the absence or presence of 100 nM RA-2. Currents from individual patches were normalized to the effect of 10 µM Ca2+ in the absence of RA-2. Data are mean ± S.D. (n = 3, experiments per data point).
