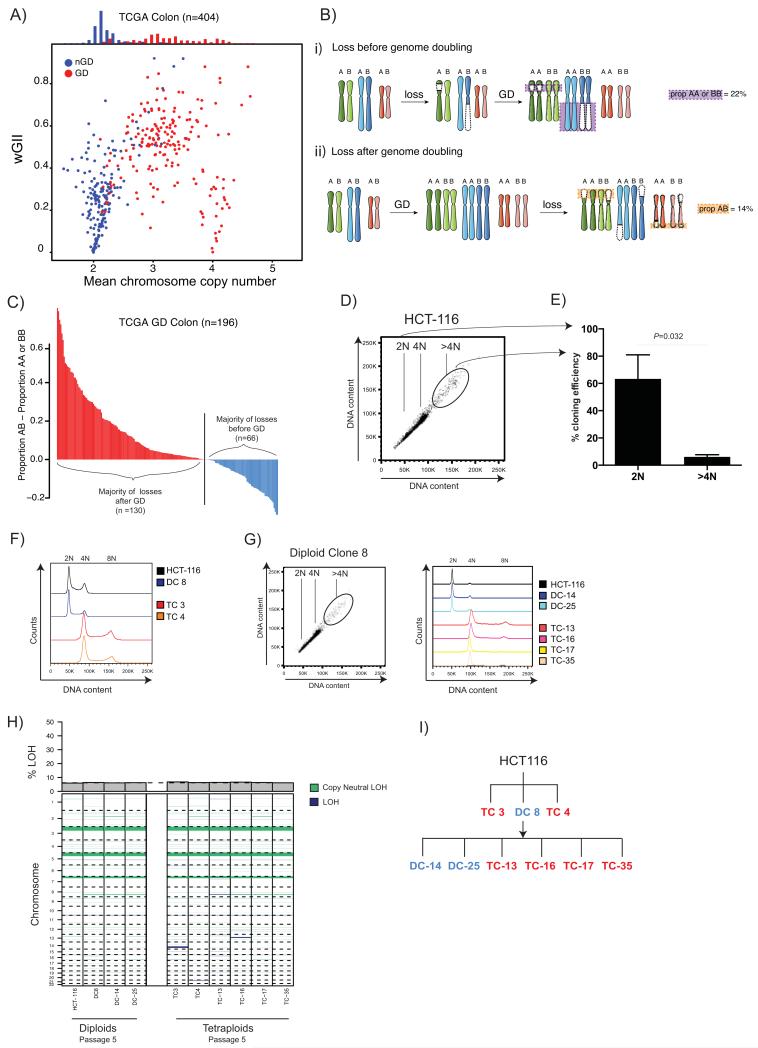
Figure 1.
A) Relationship between weighted mean chromosome copy number and wGII. Each circle represents one TCGA CRC tumour sample. Red depicts genome-doubled (GD) samples; blue non-genome-doubled (nGD) samples (see Methods). A histogram of weighted mean chromosome copy number for GD (red) and nGD (blue) is shown above.
B)
i) Copy number losses that occur on the background of a diploid genome prior to genome doubling will result in LOH, whereby one of the parental alleles is lost. In tumours that harboured chromosomal instability prior to genome doubling the majority of losses will be unbalanced, involving LOH. Unbalanced losses to two copies (AA or BB) are depicted with a purple box with purple dotted lines.
ii) In tumours where genome doubling was an early event, prior to the onset of chromosomal instability, the majority of losses to two copies will be balanced without LOH. Balanced losses to two copies (AB) are depicted with an orange box with orange dotted lines around them.
C) Timing of genome doubling estimated using copy number and LOH profiles. Each bar represents one genome-doubled tumour and its height corresponds to the proportion of AB – proportion AA or BB copy number states. Tumour genomes where the majority of losses to two copies are likely to have occurred after genome doubling are shown in red (n =130; proportion AB > proportion AA or BB), whereas those where the majority of losses are likely to have occurred before doubling are shown in blue (n=66; proportion AB < proportion AA or BB).
D) Flow cytometry shows a >4N population in the MIN colon cancer cell line HCT-116. 2N, 4N and <4N populations are indicated on the flow cytometry plot.
E) Cloning efficiency of 2N and >4N cells is shown with mean and standard error of mean (3 experiments). Tetraploid cloning efficiency was significantly lower than diploid cloning efficiency (P=0.0322, Student’s t-test). Diploid cloning efficiency was assessed using CellTiter-Blue (CTB) reagent (colonies were identified as wells with CTB value >1.5x mean average of blank wells) and the Poisson-corrected cloning efficiency was calculated (see Methods). Tetraploid cloning efficiency was calculated by verifying the percentage of surviving tetraploid clones using flow cytometry (flow cytometry data not shown).
F) After single-cell sorting, DNA content was assessed by flow cytometry with Hoescht staining. Two tetraploid clones (TC 3 and TC 4, at passage 3), one diploid clone (DC 8) and HCT-116 are shown.
G) Flow cytometry of the diploid clone DC 8 also shows a small >4N sub-population. Two further diploid clones (DC-14 and DC-25) and four tetraploid clone (TC-13, TC-16, TC-17 and TC-35) were isolated from DC 8, and their DNA content as assessed by flow cytometry with Hoescht staining is shown (passage 3).
H) LOH states of early (passage 5) diploid and tetraploid clones analysed by SNP6.0. Dark-blue LOH events in tetraploid clones are likely to have occurred prior to genome doubling. A barplot depicting the proportion of the genome displaying LOH is shown above, the black dotted line depicts the mean proportion LOH in diploids. The majority of LOH events are present in both diploid and tetraploid clones.
I) A family tree depicting all diploid and tetraploid clones used in this study. Tetraploid clones are shown in red; diploid clones in blue.

