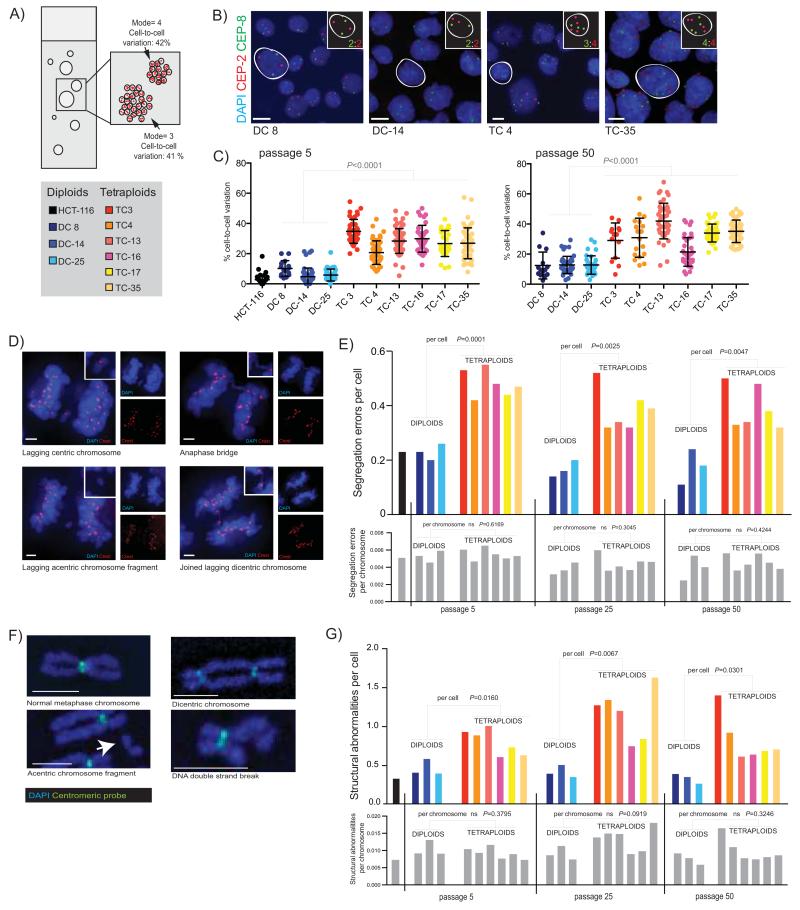
Figure 2.
A) Diagram of a clonal FISH slide, showing the two measures of chromosome number deviation that can be scored; cell-to-cell variation in chromosome number is the percentage of cells that deviate from the modal chromosome number of each individual colony. Colony-to-colony variation reflects differences in the modal chromosome copy number between colonies.
B) Example images of colonies from four clones with chromosome 2 (CEP2) shown in red, and chromosome 8 (CEP8) in green. Individual cells have been highlighted, and their copy number state for these two chromosomes is shown in the inset. Scale bar (in white) = approx.10μm.
C) Cell-to-cell variation in chromosome number. The average percentage deviation of two chromosomes, chromosome 2 and 8, is shown for all clones at both passage 5 and passage 50 (clones all scored using an Ariol automated microscope system, except DC 8, TC 3 and TC 4 at passage 50 which were scored using a DeltaVision microscope). Passage numbers shown throughout are correct to within 4 passages. Colonies with <10 cells were excluded from analysis. Each point represents one colony. Median number of cells: passage 5= 2479, passage 50= 2105.
D) Chromosome segregation errors in anaphase were visualized by immunofluorescence. Representative single z-stack images show types of segregation errors that were scored. Blue=DAPI, Red=Crest. Side panels show each channel individually, and inset shows a close-up of the segregation error. Scale bars (in white) = approx. 3μm.
E) Chromosome segregation errors on a per cell and per chromosome basis. Fifty anaphases were scored for each cell line; only data from bipolar anaphases is shown. On a per cell basis are shown on top graph (coloured bars represent individual clones, see key above). P values refer to comparisons between diploids and tetraploids at each passage (Student’s T-test). On a per chromosome basis (lower graph, all grey bars, representing the same clones as in immediately above graph) there is no significant difference in segregation errors per chromosome: P values are indicated above bars.
F) Representative images of normal and abnormal metaphase chromosomes are shown, stained with DAPI and probed with an all-human centromere probe. Scale bars (in white) = approx. 2.5μm.
G) Structural abnormalities on a per cell and per chromosome basis in diploid and tetraploid clones. Number of structural abnormalities per cell is shown on the top colored graph (P values refer to comparisons between diploids and tetraploid clones at each passage), and the number of structural abnormalities per chromosome is shown on the below graph with grey bars representing exactly the same clones as in above graph (P values for comparisons between diploid and tetraploids at each passage are indicated above bars). Median number of spreads scored at each passage: passage 5 = 25, passage 25 = 29, passage 50 = 27, and HCT-116 = 37.

