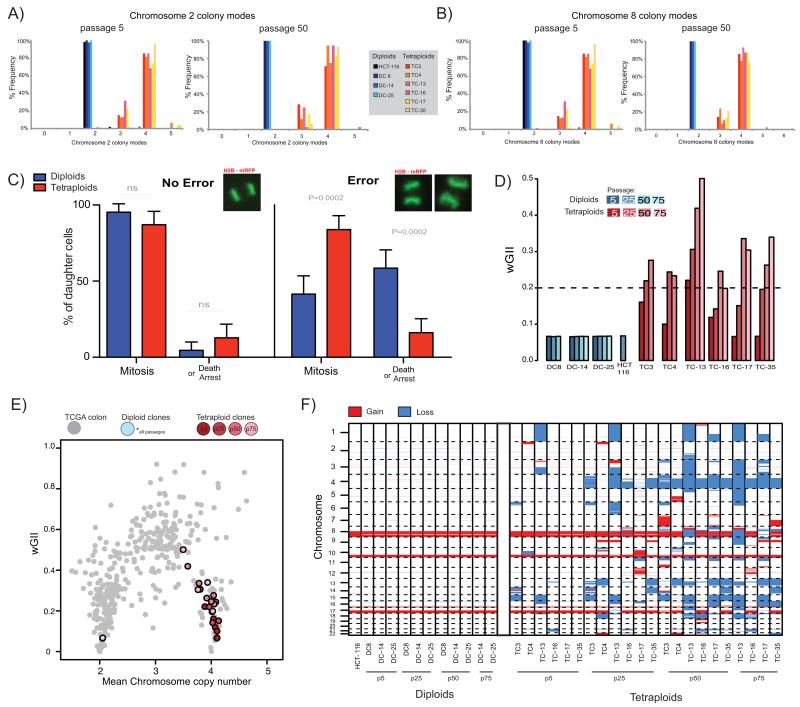
Figure 3.
A, B) Colony-to-colony variation in modal chromosome copy number for chromosome 2 (A), and chromosome 8 (B). Frequency of different colony modes from clonal FISH data is shown from all clones at passage 5 and at passage 50. Median number of colonies scored: passage 5 = 44, passage 50 = 39.
C) Live-cell imaging of H2B-mRFP expressing cell reveals different daughter cell-fates after segregation errors. The percentage frequency of each cell fate (mitosis or death or arrest [arrest = interphase >48hrs post division, see Methods]) in long-term live-cell imaging studies of all diploid and tetraploid clones either after no error or after a segregation error is shown. Example images of mitoses are shown above each panel. Data shown is an amalgamation of all clones (for individual results and n numbers see Supplementary Fig. 4G, and also see Supplementary Movies A-F).
D) wGII at different passages for diploid and tetraploid clones. Dashed line indicates wGII=0.2, a threshold separating MIN and CIN cell lines (23).
E) Weighted mean chromosome copy number versus wGII for CRC tumours from TCGA (grey), diploid clones (blue) and tetraploid clones (red) at different passages. Diploid clones at all passages overlay the same point. Lighter colours represent later passages for tetraploid clones.
F) Genome-wide copy number losses and gains for all clones at passage 5, 25, 50 (and passage 75 for DC-14, DC-25, TC13, TC-16, TC17 and TC-35). Blue sections represent loss and red sections represent gain (relative to ploidy).

