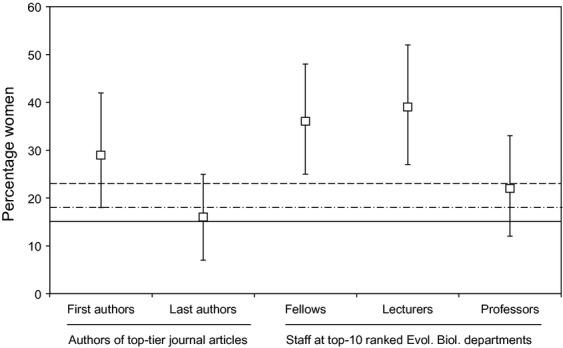
Figure 4.

The percentage of invited speakers that were women, selected by randomizations from baseline populations of authors in top-tier journals (first and last authors) and faculty members (error bars = 95% confidence intervals). Horizontal lines under the x-axis indicate the specific category groupings that the data points belong to. The horizontal continuous line in the plot indicates the sex ratio among the realized invited speakers at ESEB 2011, the dash-dotted line indicates the sex ratio among symposium organizers at ESEB 2011 and the dashed line indicates the sex ratio among all initially invited speakers at ESEB 2011, including those who declined to participate.
