
Figure 1.
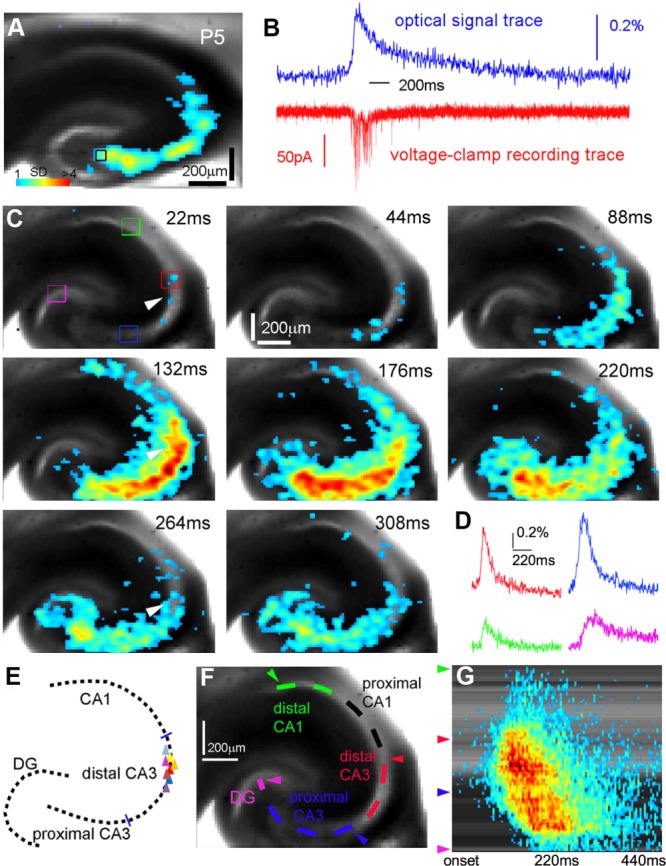
Spontaneous global network activation (GNA) in the developing mouse hippocampus exhibits both strong forward and backward propagation from distal CA3. A,B: Voltage-sensitive dye (VSD) imaging and simultaneous whole-cell recording indicate that GNA is tightly correlated with single neuronal activity. The measurements were taken from a proximal CA3 site as indicated by the small black square. The VSD image frame in A was plotted beginning at the peak of excitatory synaptic input to the recorded neuron. Color-coded activity is superimposed on the background slice image. The color scale codes VSD signal amplitude expressed as standard deviation (SD) multiples above the mean baseline. B shows the aligned optical signal trace (VSD signal in the percentage change of pixel intensity [ΔI/I%]) and voltage-clamp recording trace. C: Time series data from VSD imaging of spontaneous GNA. The arrowhead indicates the initiation site in distal CA3. D: Time courses of VSD signal from the regions of interest indicated by the colored rectangles in C are plotted from GNA onset. E: Schematic distribution of spontaneous GNA initiation zones (eight representative slices). Each triangle represents one slice sample. F,G: Space–time analysis of GNA propagation shown in B. F shows an analysis curve aligned with the hippocampal circuitry in the slice image, and G is the space–time map with the y-axis indicating the location along the analysis curve shown in F (e.g., the green, red, blue and pink arrowheads correspond to those sites indicated in F) and with the x-axis denoting the time progression from the activity onset.