
Figure 2.
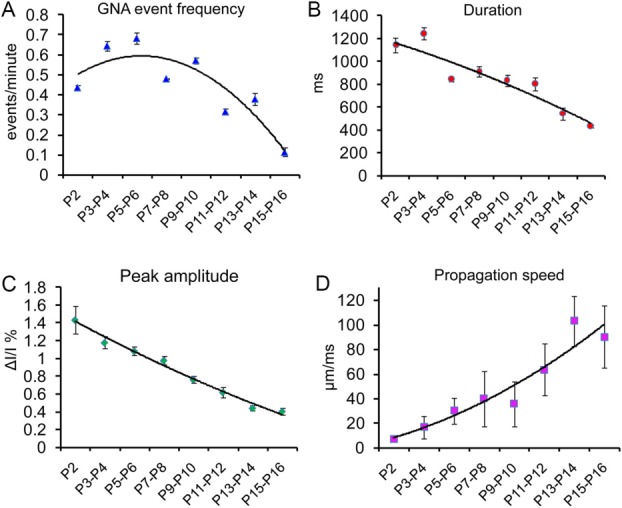
Developmental changes of GNA. A–D: Average GNA event frequency, duration, peak amplitude, and propagation speed, respectively, during P2–P16. The curves are polynomial fits through data points (each measured from several sampled events from four or five slices). The values represent mean ± SE.