Figure 4.

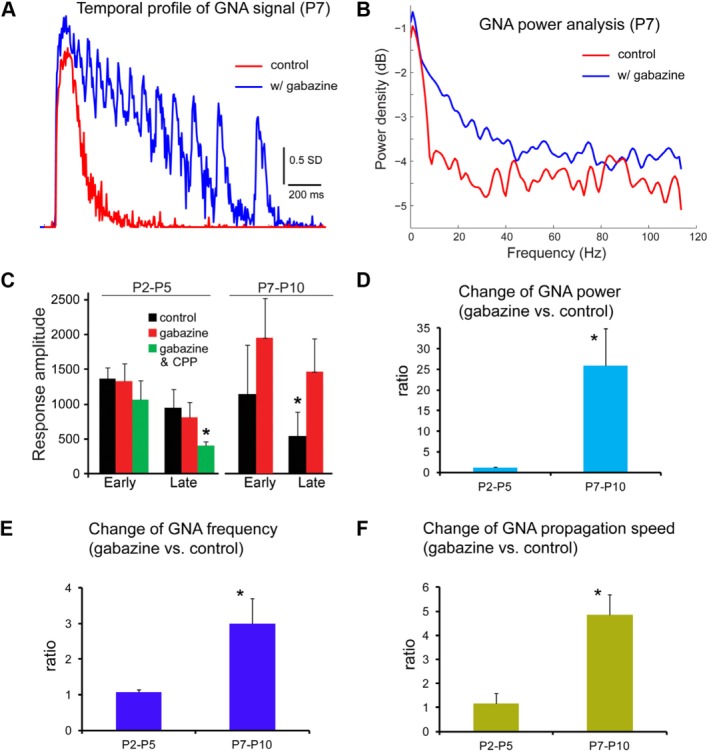
Characterization of changes of GNA properties in the presence of gabazine in comparison with the control condition. A: Temporal profiles of GNA from the CA3 region of the P7 slice illustrated in Figure 3D,E for control and gabazine conditions, respectively. B: Power density function analysis of GNA for control and gabazine conditions of the P7 slice, which clearly shows increased power at higher oscillation frequencies. C: Average response amplitude (early and late response phases) of GNA across the entire hippocampus at P2–P5 and P7–P10 (N = 5–6 slices each) with different experimental conditions. The early and late response phases are defined as the time durations of 66–132 msec and 198–264 msec postphotostimulation, respectively. The summed response amplitude of activated pixels is in units of SD. *P < 0.05 compared with control. The bar graphs represent mean ± SE. D–F: Changes of GNA power, frequency, and propagation speed in the presence of gabazine, respectively. For the GNA power analysis, the VSD signal was acquired by averaging the pixels across the CA3 region from each image frame; the averaged values constituted the data points of the VSD signal trace in temporal order. The signal trace was detrended by linear regression to remove the baseline drift and then subtracted by its mean. The “pwelch” function in Matlab was used to calculate the power values at different frequencies, which were summed to obtain the GNA power for the signal trace. In D, the power ratios of P2–P5 and P7–P10 GNA events (N = 9–12 each) are 1.17 ± 0.19 and 25.9 ± 9.0, respectively. In E, the frequency ratios of P2–P5 and P7–P10 slices are 1.06 ± 0.07 and 3.0 ± 0.7, respectively. In F, the speed ratios of P2–P5 and P7–P10 events are 1.16 ± 0.42 and 4.86 ± 0.83, respectively. The y-axis indicates the average ratio of the parameter measured in the presence of gabazine compared with the control condition. *P < 0.05 compared with control.
