
Fig. 1.
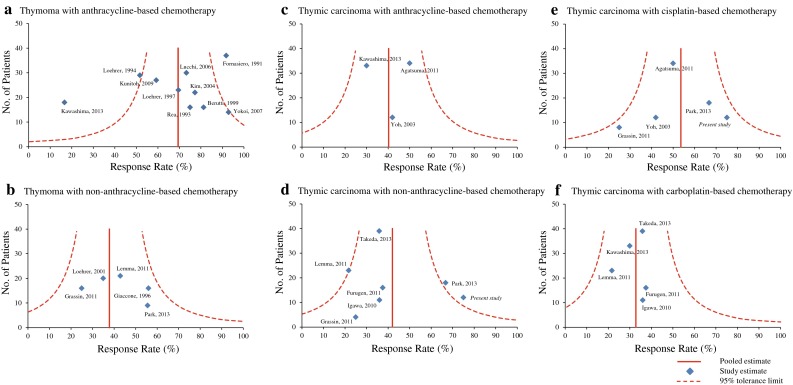
Funnel plots using response rates as an outcome for a, b thymoma and c–f thymic carcinoma in each chemotherapy category (anthracycline-based vs. non-anthracycline-based and cisplatin-based vs. carboplatin-based)
Official websites use .gov
A
.gov website belongs to an official
government organization in the United States.
Secure .gov websites use HTTPS
A lock (
) or https:// means you've safely
connected to the .gov website. Share sensitive
information only on official, secure websites.
Funnel plots using response rates as an outcome for a, b thymoma and c–f thymic carcinoma in each chemotherapy category (anthracycline-based vs. non-anthracycline-based and cisplatin-based vs. carboplatin-based)