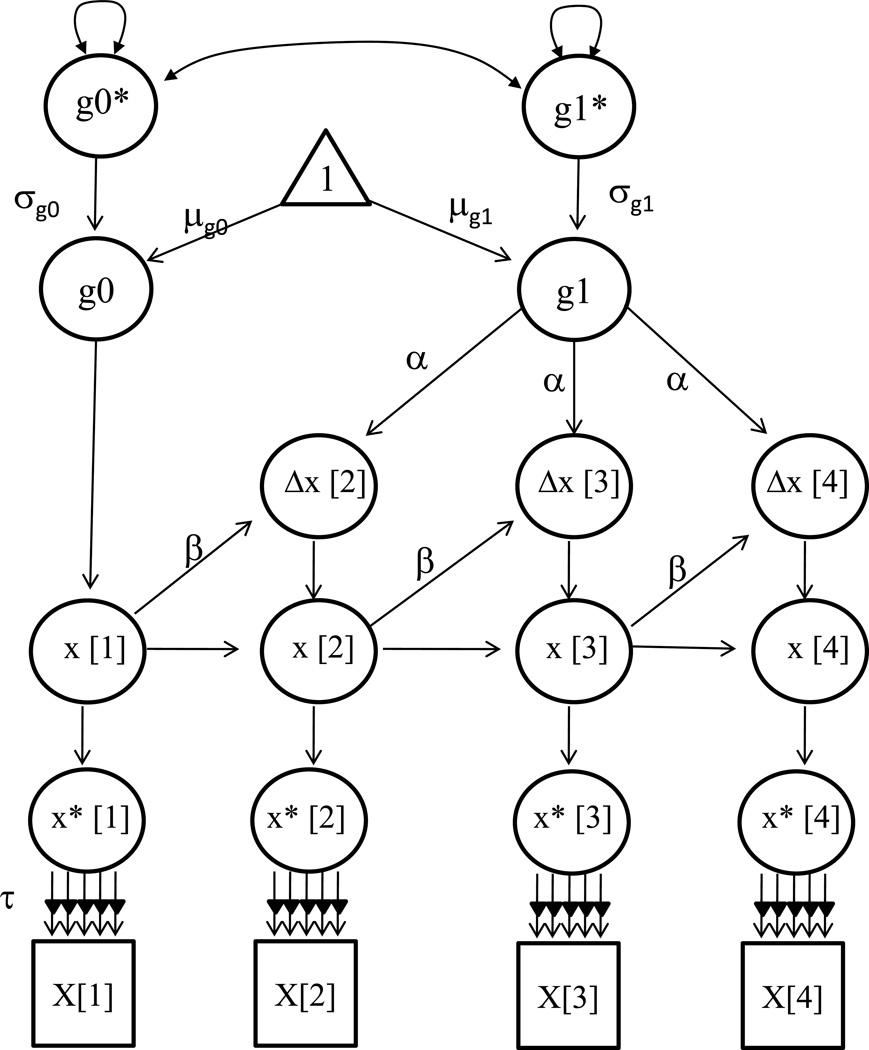
Figure 4.
A univariate dual change score model to examine trajectories on grade level changes for each indicator (X). The model includes an estimate for intercept (g0), mean intercept (µ0), and mean slope (µ1). Notes: The α represents constant changes and defines the form of the slope factor g1 (i.e., a=1 is linear change). The β represents the size of the proportional auto-regressive changes. A correlation between the intercept and slope (ρ01) is allowed, and the error variance (ψ2) is assumed to be constant at each grade level.

