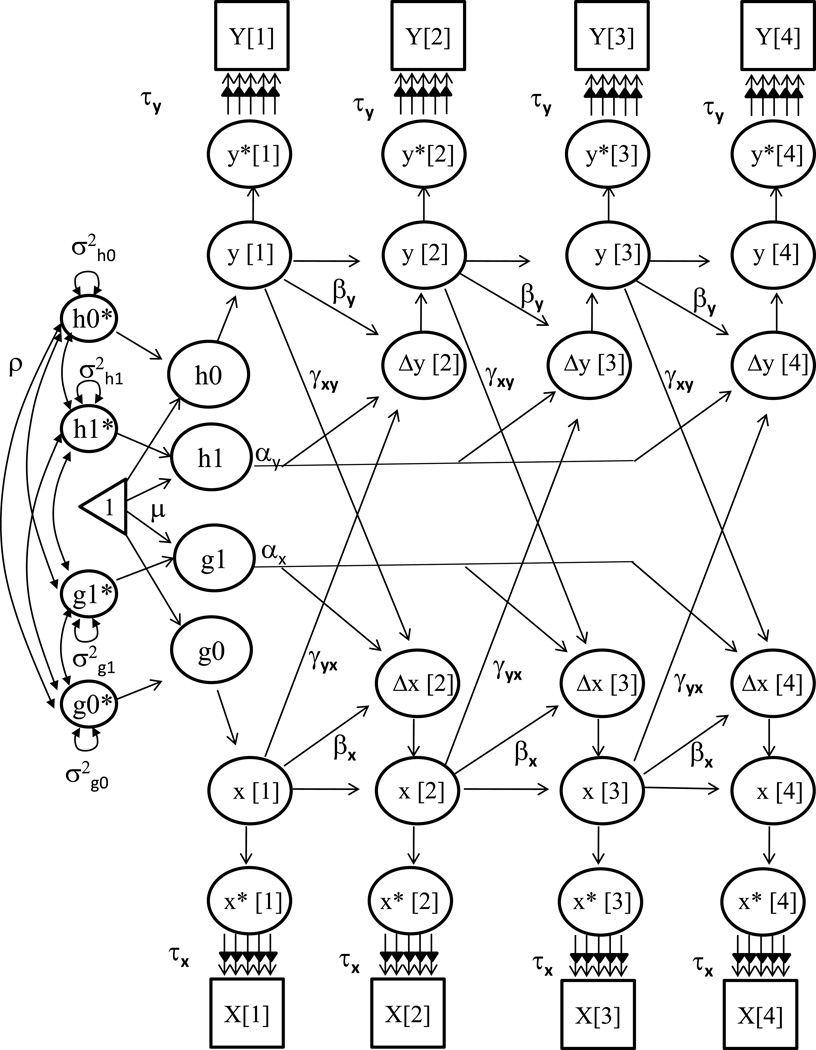
Figure 5.
A bivariate biometric dual change score model trajectories over grade level changes in two measured variables (Y and X). Notes: Error variance (ψ2) is assumed to be constant at each grade level within each factor; αy and αx represent constant change related to the slope factors ys and xs; βy and βx represent proportional change in Y and X; and cross-trait coupling is indicated by γyx and γxy. The model includes estimates for intercepts (y0 and x0), mean intercepts (µy0 and µx0), and mean slopes (µy1 and µx1). Other parameters are used to generate the decomposition of the correlation between the intercept and slope for X and Y.

