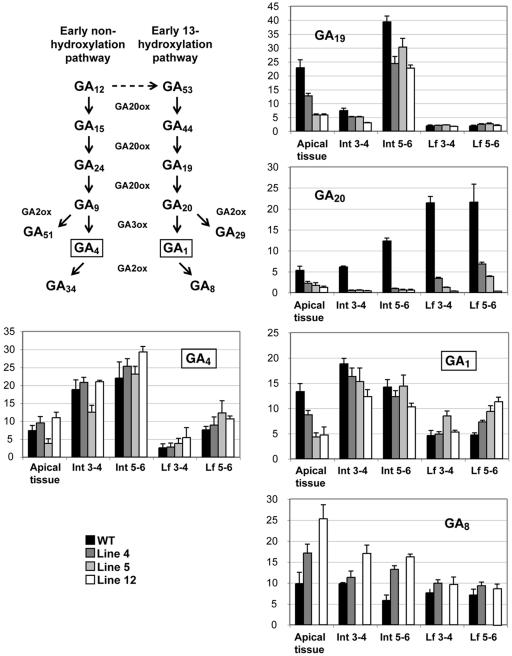
Figure 4.
GA content of apical, internode, and leaf tissue in 35S-AtGA3ox1 transgenic plants and WT. Tissue from nine individuals was pooled per genotype and tissue type. GAs from 200 mg fresh weight of pooled tissue were purified and analyzed by GC/MS-SRM using 2H2-GAs as internal standards. Data presented are the means of three technical replicates of pooled sample ±sd. GA8 levels in line 5 were not measured. Boxed GAs depict bioactive GAs.

