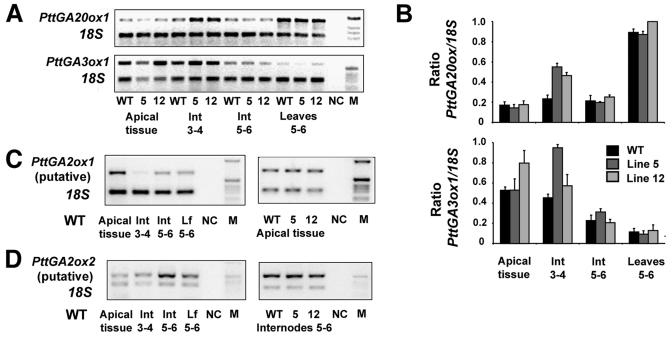
Figure 5.
GA dioxygenase expression levels, as determined by semiquantitative RT-PCR in various tissues of WT and the 35S-AtGA3ox lines 5 and 12. Different gene-specific and intron-spanning primer pairs were used together with a primer pair for the internal standard 18S. One cDNA source was used per sample that originated from pooled plant tissues (nine plants per genotype). A, The expression of PttGA20ox1 and PttGA3ox1 in various tissues of WT and line 5 and 12. B, Quantification results of two GA genes were normalized to the internal standard 18S. The average of 3 to 4 independent RT-PCRs were calculated and results plotted; bars depict se. C, The PttGA2ox1 expression was analyzed first in WT and then compared to line 5 and 12 in apical tissue. D, PttGA2ox2 transcript levels were determined in WT and compared to line 5 and 12 in young expanding internodes. Int, internodes; NC, negative control—no cDNA added to the PCR mixture; M, DNA size marker.

