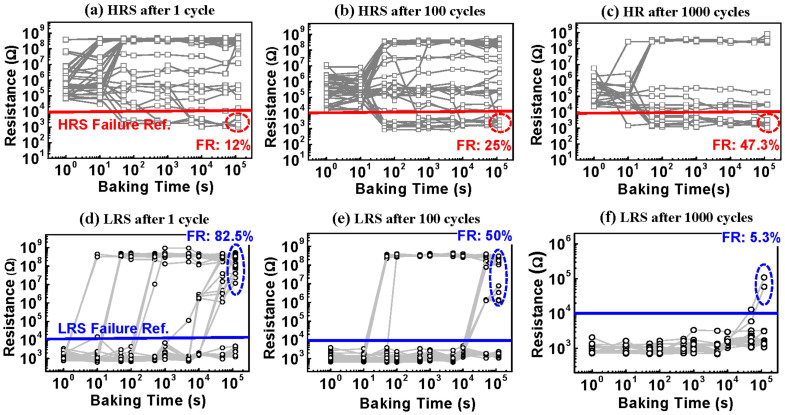
Figure 4. The retention test of the HRS and LRS after various switching cycles.
The HRS retention after (a) 1 cycle, (b) 100 cycles and (c) 1000 cycles, with a baking temperature of 180°C. The HRS either changed to the LRS or moved to higher resistance states. The probabilities of changing to the LRS were 12% at 1 cycle, 25% at 100 cycles and 47.3% at 1000 cycles. As the switching cycles increased, the HRS states were more likely to change to the LRS, implying that HRS retention was degraded with cycling. The LRS retention after (d) 1 cycle, (e) 100 cycles and (f) 1000 cycles with a baking temperature of 180°C. The LRS retention was greatly improved with the cycling. After 1000 cycles, the failure rate was reduced from 82.5% to 5.3%.

