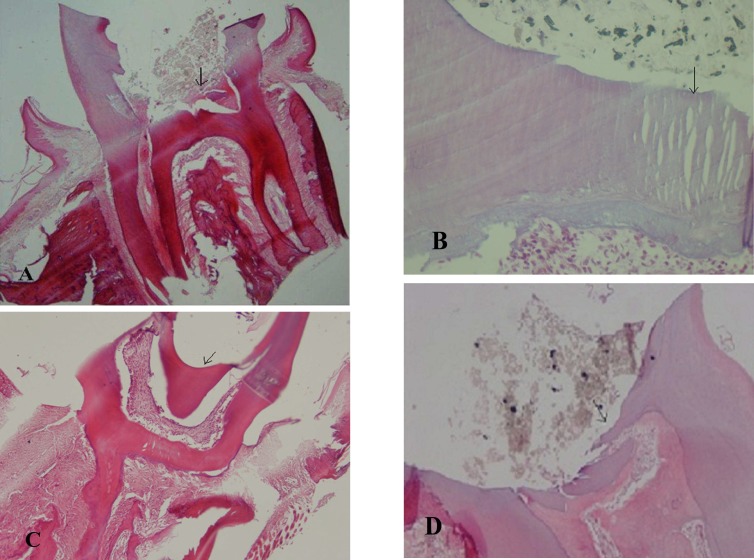
Fig. 1.
Histological findings at 4 weeks: Photomicrographs showing the presence of inflammation by H&E staining. A,B: mild inflammation in the diabetic (x400) and healthy groups (x40) respectively treated with MTA. C, D: intense © and mild (D) inflammation in the diabetic and healthy groups respectively treated with CEM (x40). Arrows indicate inflammatory cell

