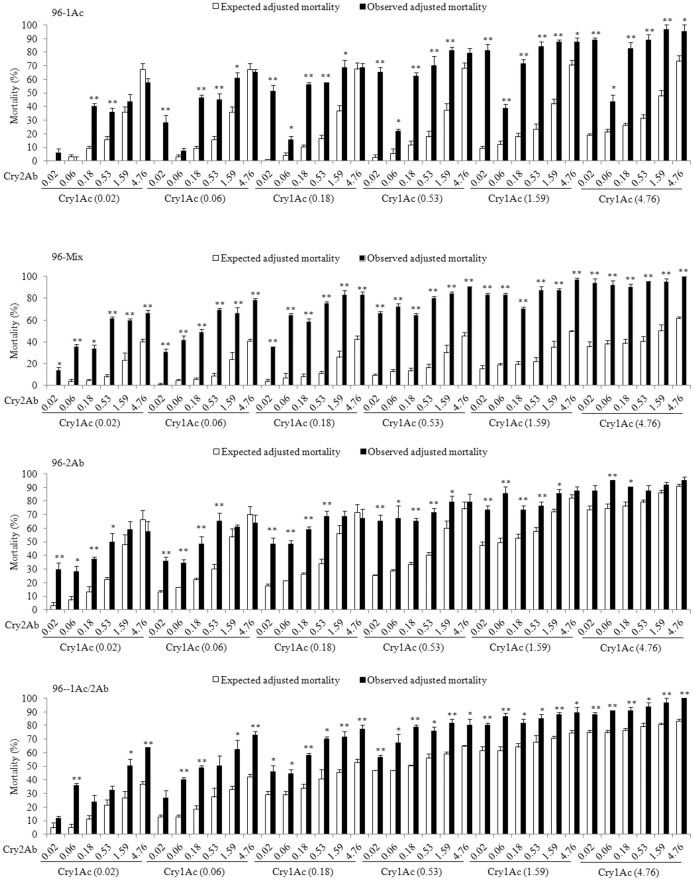
Figure 2. Observed versus expected mortality caused by combinations of Cry1Ac and Cry2Ab against four resistant strains of H. armigera (96-Cry1Ac, 96-Mix, 96-Cry2Ab, and 96-Cry1Ac/Cry2Ab).
The concentrations of Cry1Ac and Cry2Ab in each combination are indicated below the x-axis in μg protoxin per cm2 diet. Black bars show observed mortality and white bars show expected mortality. Significant differences between observed and expected mortality are indicated with asterisks (*: P < 0.05 and **: P < 0.01 based on t-tests).

