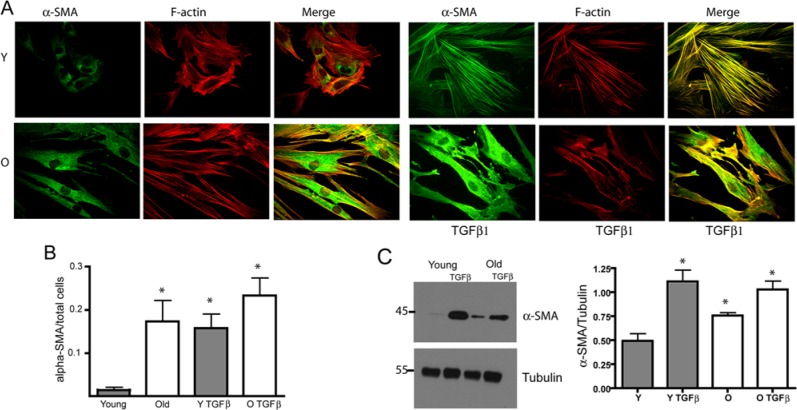
Figure 2.
Myofibroblastic differentiation. (A) Serum-starved young and old HGFs were stimulated with 10 ng/mL TGF-β1 for 72 hrs. Actin cytoskeleton distribution and α-SMA staining were evaluated through immunofluorescence. Scale bar equals 10 μm. (B) Graph indicates average ± standard error of α-SMA (+) cells normalized against total cells. Asterisk indicates a statistically significant difference between young group compared with all other conditions (p < .0001, Kruskal-Wallis test). (C) Serum-starved young and aged HGFs were stimulated with 10 ng/mL TGF-β1 for 72 hrs, and α-SMA were analyzed through Western blot of the cell lysates. Graph represents the average ± standard error of 4 independent experiments from different cell lines. Asterisks indicate a statistically significant difference between young and old fibroblasts in both resting and stimulated (TGFβ1) conditions.

