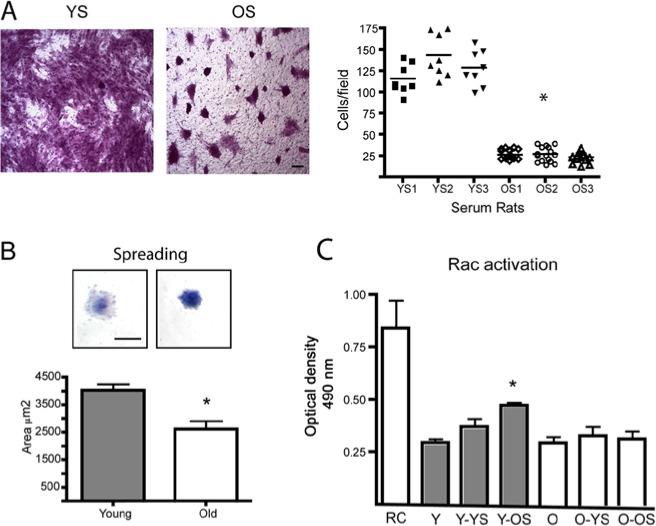
Figure 3.
Rac1 activation in young and old fibroblasts. (A) Young HGFs were placed in the upper compartment of a transwell chamber with an 8.0-µm-pore polycarbonate filter. In the lower chamber, 10% serum derived from 3 different young (YS) and old (OS) rats was used to stimulate cell migration. After 16 hrs, the migratory cells were fixed and stained, and the quantified graph represents the average ± standard error of migrating cells. Asterisk indicates a statistically significant difference between cells stimulated with 3 different samples of young serum (YS1, YS2, YS3) and cells stimulated with old serum (OS1, OS2, OS3) (Kruskal-Wallis test, p < .0001). Magnification bar equals 10 μm. (B) Cell-spreading assay was performed by plating cells over fibronectin-coated dishes. After 45 min, cells were stained with crystal violet, and the cell area was quantified with ImageJ. Magnification bar equals 15 μm. Asterisk indicates statistically significant differences between young and old fibroblasts (p < .005). (C) Young and old HGFs were stimulated with 10% serum obtained from young and old rats for 30 min. Rac activation was evaluated with a G-ELISA assay of commercial origin. Graph represents the average ± standard error of optical density (OD) measurements. Asterisk indicates a statistically significant difference between non-stimulated young cells (Y) and young cells stimulated with old serum (Y-OS) (Kruskal-Wallis test, p < .05). RC corresponds to a positive control of Rac activation. Y and O correspond to non-stimulated young and old fibroblasts. All assays were performed in cell lines derived from 4 different donors.

