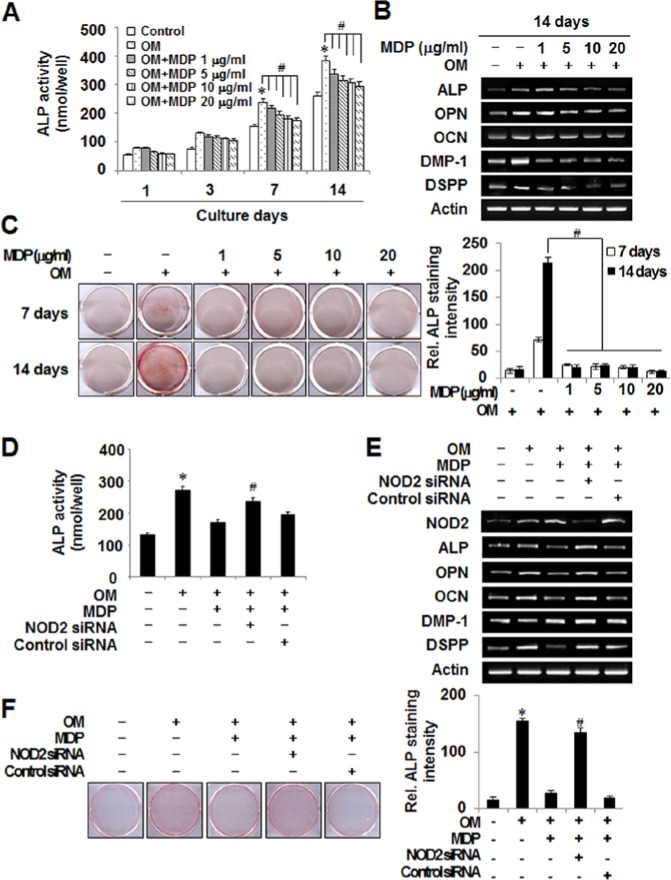
Figure 1.
MDP treatment negatively regulates odontoblast differentiation through NOD2 in HDPCs. (A) HDPCs were cultured with MDP at concentrations ranging from 0 to 20 µg/mL for the indicated days in osteogenic media (10 mM β-glycerophosphate, 10−7 M dexamethasone, and 50 µg/mL L-ascorbic acid). The unstimulated (Control) and OM-alone-treated cells (OM) were used as negative and positive controls, respectively. ALP activity was determined. (B) The mRNA expression of osteoblast/odontoblast differentiation markers was evaluated by RT-PCR. (C) The mineralized nodule formation was analyzed by alizarin red staining. The intensity of alizarin red staining was quantified as described in Materials & Methods. (D) Control siRNA- or NOD2 siRNA-transfected cells were incubated for 24 hr and further cultured with MDP (10 µg/mL) for 7 days in OM. At the end of culture, ALP activity was assessed. (E) Control siRNA- or NOD2 siRNA-transfected HDPCs were cultured in the presence of MDP (10 µg/mL) for 7 days in osteogenic media (OM). At the end of culture, the mRNA expression of osteoblast/odontoblast markers was examined by RT-PCR. (F) Mineralized nodule formation was analyzed by alizarin red staining of the cells treated as in (E). The bar graph indicates intensity of staining. *Statistically significant difference vs. control, p < .05. #Statistically significant difference in OM alone, p < .05. Similar data were obtained from 3 independent experiments. This figure is available in color online at http://jdr.sagepub.com.

