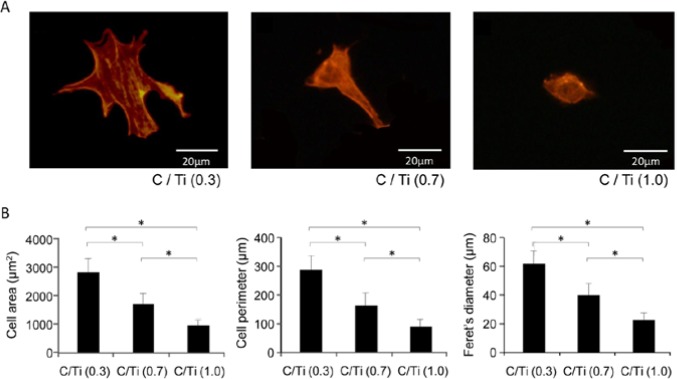
Figure 3.

Initial spreading and cytoskeletal arrangement of osteoblastic cells 12 hr after being seeded onto 3 different C/Ti titanium surfaces. (A) Representative fluorescent microscopic images of cells stained with rhodamine phalloidin for actin filaments. (B) Cytomorphometric evaluations of cell area, cell perimeter, and Feret’s diameter were performed with an image analyzer. Data have been expressed in terms of mean ± SD values (n = 5). *p < .05, indicating a statistically significant difference among the 3 different C/Ti titanium surfaces.
