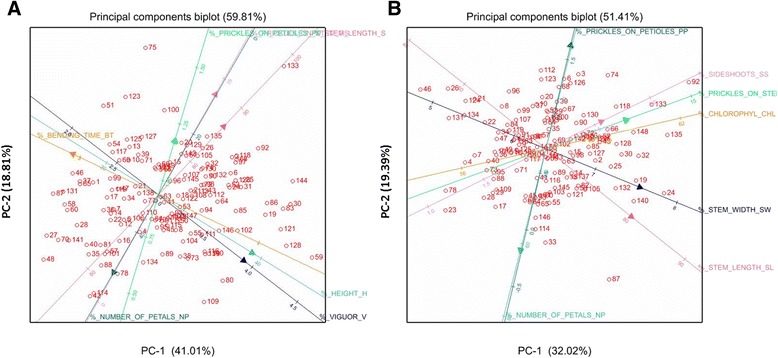
Figure 2.

Principal components biplots for all the traits, panel A for environment WAG-S; panel B for AGR. The cosine of the angle between the lines approximates the correlation between the traits they represent. Arrows pointing in opposite directions mean negative correlations. Text explaining the traits might overlap due to the Genstat programme used.
