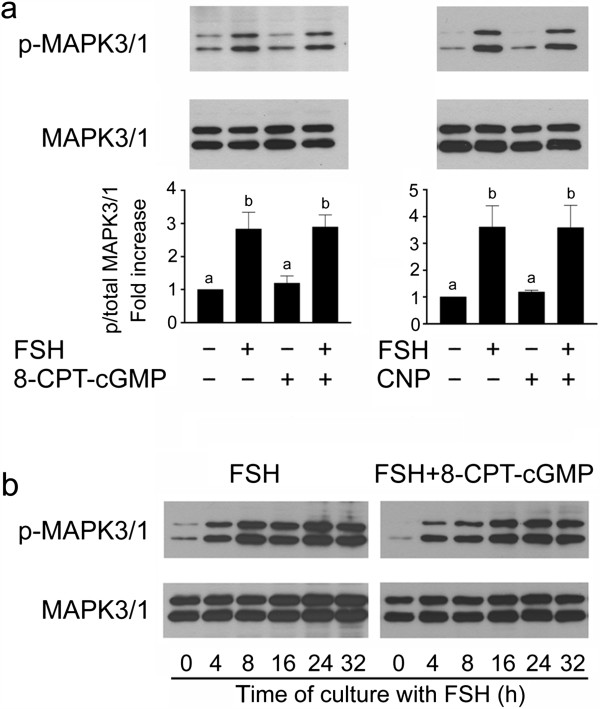
Figure 7.

Effect of FSH (1 IU/ml), CNP (100 nM) and 8-CPT-cGMP (1 mM) on activation of MAPK3/1 in cultured COCs. (a) The images show a representative result of immunoblotting of phosphorylated MAPK3/1 (top panels) and total MAPK3/1 (bottom panels) in samples of 25 COCs cultured for 4 h. The graphs represent quantification of the activated MAPK3/1 in COCs by densitometry. The results are shown as proportions of the phosphorylated and total MAPK3/1 and expressed in arbitrary units as a fold strength increase over the proportion found in COCs cultured in control medium. The different superscripts above the columns indicate significant differences (P < 0.05). (b) Time course of MAPK3/1 activation in COCs cultured in medium supplemented with FSH or FSH + 8-CPT-cGMP.
