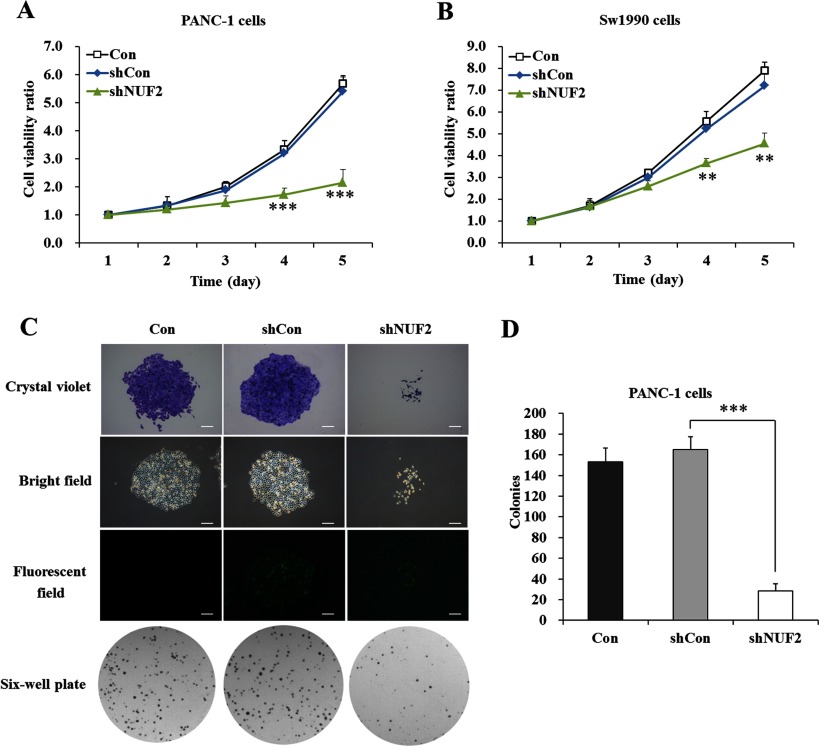
Figure 4. Effects of NUF2 knockdown on proliferation and colony formation of pancreatic cancer cells.
Growth curves of PANC-1 cells (A) and Sw1990 cells (B) with three treatments (Con, shCon and shNUF2) determined by MTT assay. Data represent the means±S.D. of three independent experiments. **P<0.01, ***P<0.001, compared with shCon. (C) Representative images recorded under micro and macro view, representing the size and the number of colonies in each group of cells. Scale bars=250 μm. (D) Colony numbers of PANC-1 cells were counted. Data represent the means±S.D. of three independent experiments. ***P<0.001, compared with shCon.

