
Fig. 1.
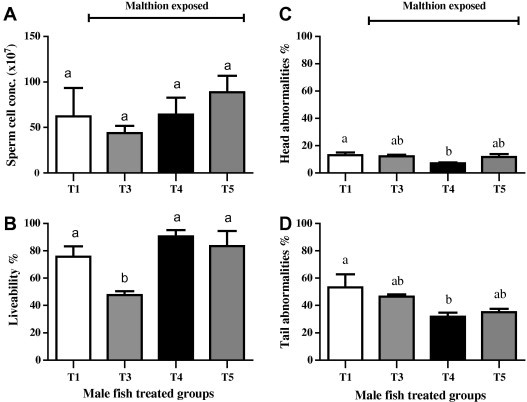
Semen characteristics in male Nile tilapia (O. niloticus) after exposure to 1 mg/l (1 ppm) of malathion for 10 days. T1 (□) was negative control (unexposed, fed basal diet). T3 () was positive control (exposed, fed basal diet). T4 () and T5 () were pollen fed, but the later was returned to diet during toxin treatment. Values (mean ± SE; n = 5 per group) with different letters were significantly different at P < 0.05.