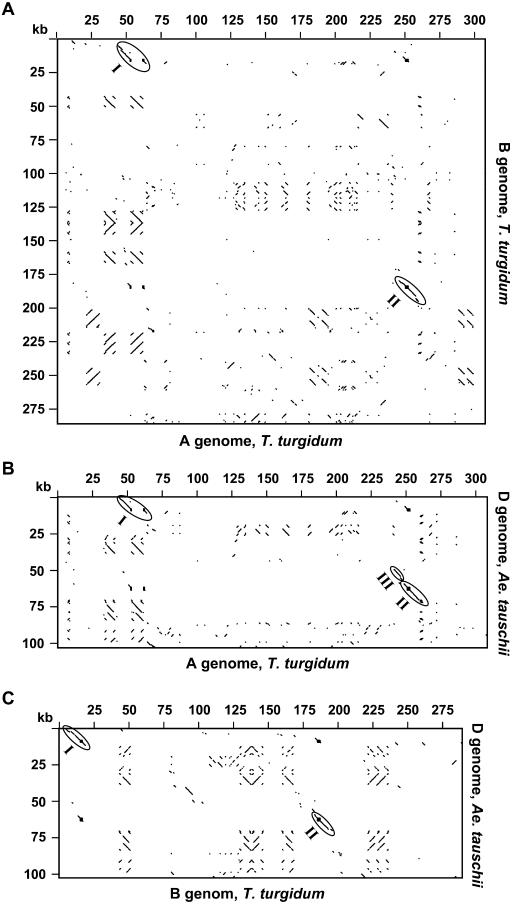
Figure 3.
Pair-wise comparisons of the orthologous HMW-glutenin regions of the A, B, and D genomes. The Dotplot analyses compared the complete available sequences in the vicinity of the Glu-A1 and Glu-B (Fig. 3A), Glu-A1 and Glu-D1 (Fig. 3B), and Glu-B1 and Glu-D1 (Fig. 3C) loci. Sequence match criteria of 60% over a 40-bp window was used in the analyses. Colinear regions are circled and numbered with I, II, and III. The gap in Region I of Figure 3, A and B is caused by the Wis-3 insertion in the Ay HMW-glutenin gene.

