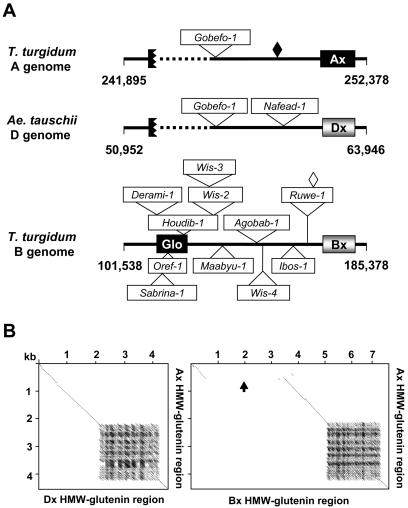
Figure 5.
Comparison of orthologous sequences in the x-type HMW-glutenin regions. A, Organization of regions containing the globulin and x-type HMW-glutenin genes. Genes are represented by shaded boxes or black boxes (inactive genes). Retroelements are boxed and their insertion positions indicated by either triangles or solid vertical lines. Diamonds represent MITEs. Dashed lines represent regions deleted in the A and D genomes based on comparison with the corresponding region of the B genome. The black box with a broken border represents the second globulin gene with a portion of the coding region deleted. B, Dotplot analyses of x-type HMW-glutenin regions. All inserted repetitive DNA sequences were removed from the regions used in these comparisons prior to the analyses. Sequence match criteria is 60% over a 40-bp window. The black arrow indicates a region that is either an insertion in the B genome or a deletion in the A genome.

