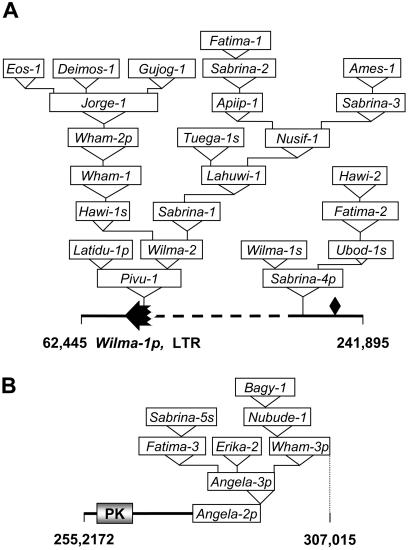
Figure 6.
Organization of retroelements in the intergenic regions of the Glu-A1 locus. A, Nested retrotransposons in the region between the y-type HMW-glutenin and the second globulin gene. The horizontal solid line represents the intergenic region. The partial Wilma LTR (black arrow) and MITE (black diamond) elements indicated along the horizontal solid line are colinear with the sequences present in D and B genomes (Kong et al., 2004). The dashed line represents the region deleted only in the A genome based on the comparison with the colinear regions of the wheat D and B genomes. Retroelements are boxed and their insertion positions indicated with either a triangle or a solid vertical line. The letters s and p following the names of the retroelements indicate solo and partial, respectively. B, Nested retrotransposons in the region after the protein kinase. The protein kinase gene is represented by a shaded box. The horizontal solid line represents the intergenic region. Retroelements are boxed and their insertion positions indicated with either a triangle or a solid vertical line.

