Figure 1.
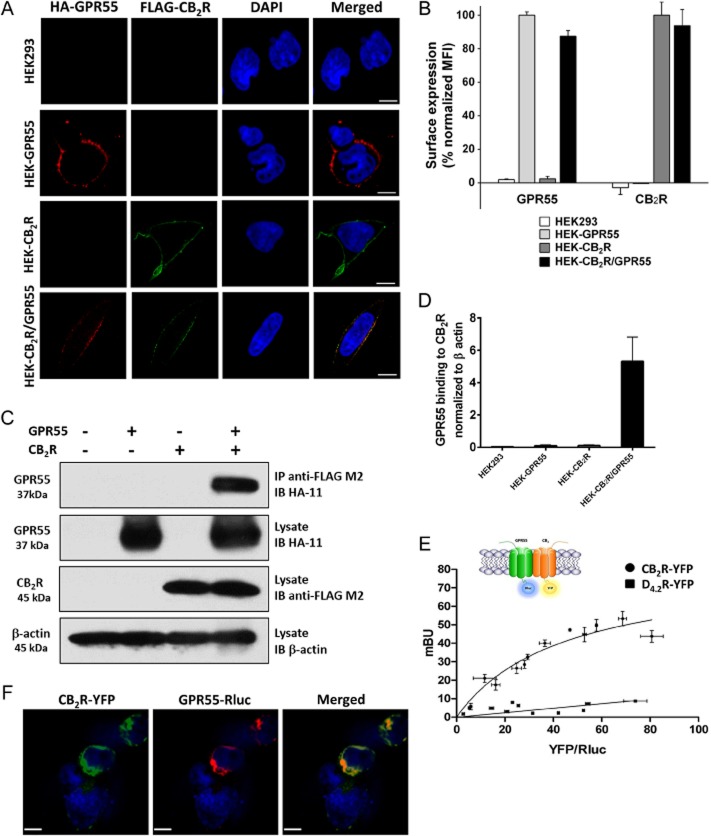
GPR55 and CB2 receptors co-localize on the surface of HEK293 cells and form heteromers. (A) HEK293 cells stably expressing HA-tagged GPR55 (HEK-GPR55), FLAG-tagged CB2 receptor (HEK-CB2R), both receptors (HEK-CB2R/GPR55) or none (HEK293) were fed with anti-HA and anti-FLAG antibodies for 30 min, followed by staining with Alexa Fluor 594-conjugated goat anti-mouse IgG1a (red) and Alexa Fluor 488-conjugated goat anti-mouse IgG2b (green) antibodies and nuclei were counterstained with DAPI. Images were captured and analysed with Zeiss LSM510 META Axioplan confocal microscope and are representative of 2–3 experiments. Original magnification: 40×. Scale bar: 20 μm. (B) Cells were stained with anti-FLAG and/or anti-HA antibody and appropriate secondary antibodies in FACS tubes, fixed and measured in a FACSCalibur flow cytometer (Becton Dickinson, CA, USA). Mean fluorescence intensity (MFI) of GPR55 staining in HEK-GPR55 cells and CB2 receptors in HEK-CB2R cells were considered as 100%, respectively, and were used to normalize receptor expression in double-expressing cells. Data are mean ± SEM from two independent experiments performed in duplicate. (C) Lysates from stable cells lines were centrifuged and parts of the supernatants were kept at −20°C for FLAG, HA and β-actin control blots while the rest of the supernatant was subjected to Co-IP. After SDS-PAGE and transferring to PVDF membranes HA-GPR55, FLAG-CB2R and β-actin were detected using anti-HA, anti-FLAG or anti-β-actin antibody respectively. Representative blots from five independent experiments are shown. (D) Analysis of Co-IP results was conducted by densitometry of protein bands in blots using ImageJ. Data are mean ± SEM from four independent experiments. (E) BRET saturation experiments showing CB2R-GPR55 heteromerization were performed using cells transfected with 0.5 μg of cDNA corresponding to GPR55-Rluc and increasing amounts of cDNA (0–3 μg cDNA) corresponding to CB2R-YFP. As negative control, cells were also transfected with cDNA corresponding to GPR55-Rluc (0.5 μg) and dopamine D4.2R-YFP (0 to 4 μg cDNA). Both fluorescence and luminescence for each sample were measured before each experiment to confirm similar donor expressions (approximately 150 000 bioluminescence units) while monitoring the increase in acceptor expression (100 to 80 000 net fluorescence units). The relative amount of BRET is given as the ratio between the fluorescence of the acceptor minus the fluorescence detected in cells expressing only the donor and the luciferase activity of the donor. BRET data are expressed as the mean ± SEM of 4–8 different experiments; data are grouped according to the signal provided by the BRET acceptor. mBU, mili BRET units. (F) HEK293 cells transiently co-transfected with GPR55-Rluc and CB2R-YFP were fixed and incubated with polyclonal anti-GPR55 antibody followed by staining with Alexa Fluor 546-conjugated goat anti-rabbit IgG antibody, for GPR55-Rluc receptor visualization (red channel). Cell nuclei were stained with TO-PRO-3 (blue channel). Cells were inspected under LSM 510 META (Zeiss, Jena, Germany) inverted confocal microscope equipped with a 40xP-Neofluar (NA 1.3). CB2R-YFP was visualized directly following excitation with the argon laser at 488 nm (green channel). Images were acquired using the Zeiss software (Aim4) and are representative of 2–3 experiments. Original magnification: 40×. Scale bar: 7 μm.

