
Figure 5. .
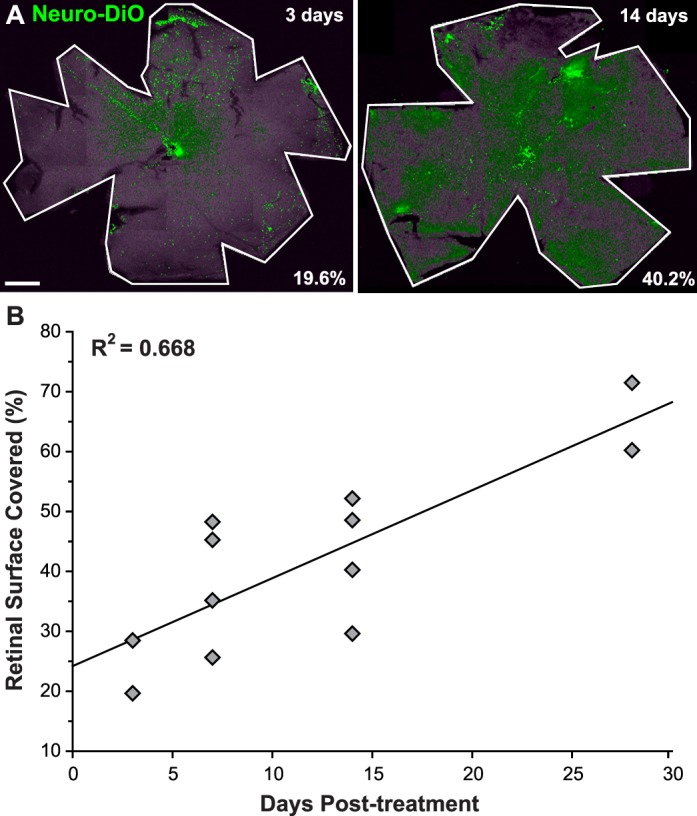
Retinal deposition of Neuro-DiO released from 50 nm NS increases with time. (A) Confocal micrographs of whole mounted retina demonstrating Neuro-DiO (green) deposition after 3 days (left) and 14 days (right). The percentage of retinal surface covered by Neuro-DiO was measured and is shown in the lower right corner. (B) Scatter plot showing a linear increase in the percentage of retinal surface covered by Neuro-DiO with increasing time. Each diamond represents one retina. Scale bar: 500 μm.